
Given the benefits of compounding, good quality large cap stocks are the best way for investors to get multibagger returns over a longer period of time. If an investor would just buy shares of established large cap stocks and hold them for a long period of time, the process of compounding that these stocks offer would itself ensure that the investor’s stock portfolio multiplies several times over.
If you invest Rs. 100,000 in a large cap stock growing at a CAGR of 15%, at the end of 10 years you would have Rs. 404,556 and at the end of 20 years, this amount will grow to Rs. 1,636,654 (not counting the dividends that the investor would get in addition).
Here’s an interesting tweet from the week gone by:
Two Funds complete 25 yrs today
Franklin Bluechip (Large Cap) and Franklin Prima (Midcap) launched on 1st Dec 1993If u had invested 1 lac at inception, value today is
Franklin Bluechip: 1.03 cr (20.45% CAGR)
Franklin Prima: 88 lacs (19.67% CAGR)
Midcaps better returns?
— Nagpal Manoj (@NagpalManoj) December 1, 2018
Also Read: 7 Low Risk Stocks For Long Term Wealth Creation
Expected Return in Large Cap Stocks
5 Large Cap Stocks Offering Multibagger Returns
[1] ITC
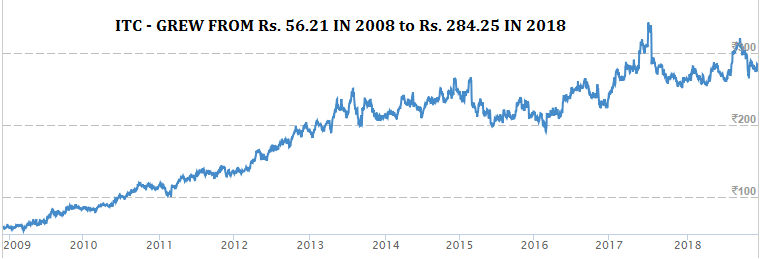
Over the past 10 years, ITC’s stock price has grown at a CAGR of 18%, from Rs. 56.21 in 2008 to Rs. 284.25 in 2018, without factoring the consistent dividend that it pays. In addition, ITC has paid over Rs. 60 as dividends over the past 10 years.
| Dividend History | ||||||
| Date | 25-May-18 | 5-Jun-17 | 30-May-16 | 3-Jun-15 | 3-Jun-14 | 31-May-13 |
| Amount (Rs.) | 5.15 | 4.75 | 8.50 | 6.25 | 6.00 | 5.25 |
| Date | 11-Jun-12 | 10-Jun-11 | 10-Jun-11 | 9-Jun-10 | 13-Jul-09 | 16-Jul-08 |
| Amount (Rs.) | 4.50 | 2.80 | 1.65 | 10.00 | 3.70 | 3.50 |
About 85% of their EBIT comes from the cigarette business. ITC has consistently improved cigarette performance after steep rise in taxes during FY 2018. In Q2 FY 2019, ITC’s revenues grew by 15.45% to Rs 11,272.51 Cr. driven by cigarette revenue growth of 10.36% with volume growth of ~5.5%.
| ITC | Sep-17 | Jun-18 | Sep-18 | Q-o-Q % | Y-o-Y % |
| Revenue (In Rs. Cr.) | 9,763.92 | 10,874.59 | 11,272.51 | 3.66% | 15.45% |
| EBITDA (In Rs. Cr.) | 3,761.51 | 4,202.12 | 4,205.97 | 0.09% | 11.82% |
| EBITDA Margin (%) | 38.52% | 38.64% | 37.31% | -3.44% | -3.15% |
| PAT (In Rs. Cr.) | 2,639.84 | 2,818.68 | 2,954.67 | 4.82% | 11.93% |
| PAT Margin (%) | 27.04% | 25.92% | 26.21% | 1.12% | -3.05% |
| EPS | 2.15 | 2.29 | 2.40 | 4.80% | 11.63% |
| Segment – Cigarette | Contribution | Sep-17 | Jun-18 | Sep-18 | Y-o-Y % |
| Revenue | 41% | 4,554.21 | 5,127.59 | 5,026.06 | 10.36% |
| EBIT | 85% | 3,291.67 | 3,558.39 | 3,579.07 | 8.73% |
[2] HDFC Bank
HDFC bank’s deposits have grown at an average CAGR of 30% for the past 10 years and its stock price has grown at a CAGR of 28.46%, from Rs. 167.02 in 2008 to Rs. 2044 in 2018.
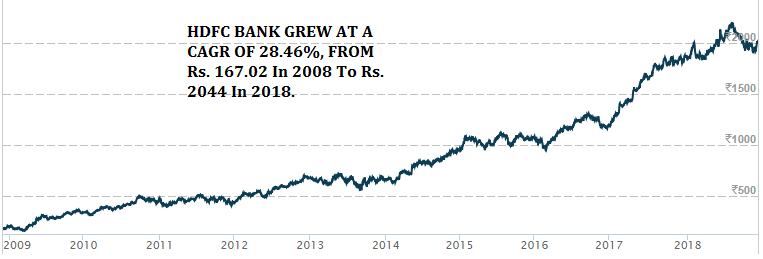
Net profit for HDFC bank in the past 10 years has grown exactly in line with deposit growth @ 30% CAGR. Net NPAs have remained at 0.40% which is lowest in the industry. Further, net interest margins for the bank have remained ~ around the current level of 4.3%, thanks to the large base of CASA deposits. With such a position, HDFC bank may move up or down from time to time in line with overall market movement, over a period of time however, it will more likely maintain its price growth trajectory.
| HDFC Bank | Sep-17 | Jun-18 | Sep-18 | Q-o-Q % | Y-0-Y % |
| Net Interest Income | 9,752.05 | 10,813.57 | 11,763.41 | 8.78% | 20.62% |
| Other Income | 3,605.90 | 3,818.06 | 4,015.59 | 5.17% | 11.36% |
| Operating Profit | 7,817.92 | 8,647.75 | 9,479.95 | 9.62% | 21.26% |
| Net Profit | 4,151.03 | 4,601.44 | 5,005.73 | 8.79% | 20.59% |
| Gross NPAs % | 1.26% | 1.33% | 1.33% | 0.00% | 5.56% |
| Net NPAs % | 0.43% | 0.41% | 0.40% | -2.44% | -6.98% |
[3] Larsen & Toubro
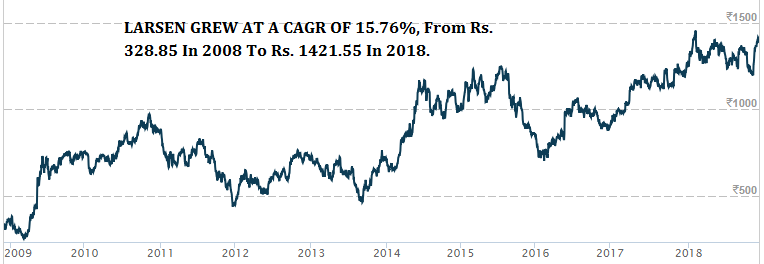
Over the past 10 years, L&T’s stock has grown at a CAGR of 15.76%, from Rs. 328.85 in 2008 to Rs. 1421.55 in 2018.
The Company has diversified presence across various categories of infrastructure projects, has strong and growing order pipeline. In Q2 FY 2019, order inflows grew strongly by 46% y-o-y to Rs. 41,921 Cr., led by robust inflows from the domestic market, which grew by 84% y-o-y to Rs. 33,632 Cr. due to pick up in domestic ordering activity. The consolidated order book stood at Rs. 281,166 Cr. as at September 30, 2018.
L&T management has retained its 10-12% order inflow growth and 12-15% revenue growth guidance going forward for this year.
| Larsen Toubro | Sep-17 | Jun-18 | Sep-18 | Q-o-Q % | Y-o-Y % |
| Revenue (In Rs. Cr.) | 26,446.76 | 28,283.45 | 32,080.83 | 13.43% | 21.30% |
| EBITDA (In Rs. Cr.) | 2,962.18 | 2,913.27 | 3,770.53 | 29.43% | 27.29% |
| EBITDA Margin (%) | 11.20% | 10.30% | 11.75% | 14.11% | 4.93% |
| PAT (In Rs. Cr.) | 2,020.30 | 1,472.00 | 2,593.41 | 76.18% | 28.37% |
| PAT Margin (%) | 7.64% | 5.20% | 8.08% | 55.33% | 5.82% |
| EPS | 12.96 | 8.65 | 15.88 | 83.58% | 22.53% |
[4] Hindustan Unilever
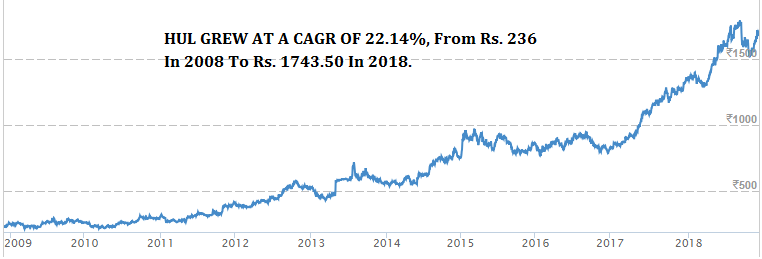
In the past 2-3 years, the entire FMCG space has faced strong competition with the entry of Ramdev’s Patanjali. In this competitive space also, HUL has delivered strong performance. The Company operates with zero debt and its stock price has grown at a CAGR of 22.14%, from Rs. 236 in 2008 to Rs. 1743.50 in 2018.
In addition the stock paid dividend of Rs. 117.5 during the same period. This is on a stock price of Rs. 202 as it was ten years back. With the current Indian demographics and consumption patterns, overall revenue and profitability for FMCG sector is likely to increase.
| Hindustan Unilever | Sep-17 | Jun-18 | Sep-18 | Q-o-Q % | Y-o-Y % |
| Revenue (In Rs. Cr.) | 8,309.00 | 9,487.00 | 9,234.00 | -2.67% | 11.13% |
| EBITDA (In Rs. Cr.) | 1,682.00 | 2,251.00 | 2,019.00 | -10.31% | 20.04% |
| EBITDA Margin (%) | 20.24% | 23.73% | 21.86% | -7.85% | 8.01% |
| PAT (In Rs. Cr.) | 1,276.00 | 1,529.00 | 1,525.00 | -0.26% | 19.51% |
| PAT Margin (%) | 15.36% | 16.12% | 16.52% | 2.47% | 7.54% |
| EPS | 5.90 | 7.06 | 7.04 | -0.28% | 19.32% |
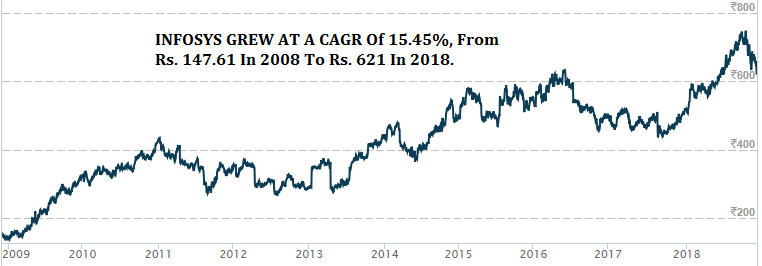
[5] Infosys
This IT Company comes as a best bet in this sector. Infosys stock price has surged over the years driven by revival in demand for IT services. Infosys stock price has grown at a CAGR of 15.45%, from Rs. 147.61 in 2008 to Rs. 621 in 2018.
The Company has issued bonus shares to its shareholders six times so far and has never missed on paying dividends in last 25 years.
| INFOSYS | Sep-17 | Jun-18 | Sep-18 | Q-o-Q % | Y-o-Y % | |
| Revenue (In Rs. Cr.) | 17,567.00 | 19,128.00 | 20,609.00 | 7.74% | 17.32% | |
| EBITDA (In Rs. Cr.) | 4,702.00 | 4,703.00 | 5,357.00 | 13.91% | 13.93% | |
| EBITDA Margin (%) | 26.77% | 24.59% | 25.99% | 5.72% | -2.89% | |
| PAT (In Rs. Cr.) | 3,726.00 | 3,612.00 | 4,110.00 | 13.79% | 10.31% | |
| PAT Margin (%) | 21.21% | 18.88% | 19.94% | 5.61% | -5.98% | |
| EPS | 8.15 | 8.30 | 9.44 | 13.73% | 15.90% | |
Very interesting Rajat!