
Aditya Birla Sun Life AMC Limited (“ABSLAMC” or the “Company”) is a joint venture between the Aditya Birla Capital Limited and Sun Life (India) AMC Investments Inc. ABSLAMC is primarily the investment manager of Aditya Birla Sun Life Mutual Fund, a registered trust under the Indian Trusts Act, 1882.
ABSLAMC also operates multiple alternate strategies including Portfolio Management Services, Real Estate Investments and Alternative Investment Funds.
ABSLAMC is one of the leading asset managers in India, with a pan India presence across 280 plus locations and a total AUM of over Rs. 3,120 billion under its suite of mutual fund (excluding its domestic FoFs), PMS, offshore and real estate offerings and 7.3 million investor folios for the quarter ending September 30, 2021.
DIVERSIFIED PORTFOLIO OFFERINGS
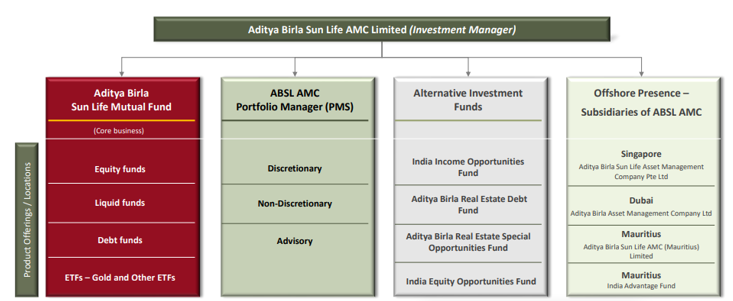
In terms of mutual fund business, the Company manages 118 mutual fund schemes comprising 37 equity, 68 debt, 2 liquid, 5 ETFs and 6 domestic FoFs with a QAAUM of Rs. 3.003 billion as on September 2021. Caters to wide range of customers including individual and institutional investors. Institutional investors contribute ~51.2% of closing AUM 45.4% is from individual investors.
The Company has achieved substantial growth in the individual investor MAAUM and customer base. The Company is the fourth largest player in terms of market share in individual MAAUM. The individual MAAUM grew at a CAGR of 18.38% taking the MAAUM mix to 47.17% as on September 2021, which was second highest increase among five largest AMCs in India.
Financial Performance
| Particulars | FY19 | FY20 | FY21 |
| Revenue (In Rs. Cr.) | 1,406.07 | 1,233.84 | 1,191.03 |
| Growth | – | -12.25% | -3.47% |
| EBITDA (In Rs. Cr.) | 682.72 | 701.76 | 724.07 |
| EBITDA Margin | 48.56% | 56.88% | 60.79% |
| EBIT (In Rs. Cr.) | 631.05 | 454.52 | 466.77 |
| EBIT Margin | 44.88% | 36.84% | 39.19% |
| PBT (In Rs. Cr.) | 645.77 | 660.73 | 695.89 |
| PAT (In Rs. Cr.) | 446.80 | 494.40 | 526.28 |
| PAT Margin | 31.78% | 40.07% | 44.19% |
| EPS (In Rs.) | 15.51 | 17.17 | 18.27 |
| EPS Growth Rate | – | 10.70% | 6.43% |
| Historic P/E (Closing Price of 31st March) | – | – | – |
| CURRENT P/E | 31.60 | ||
| CURRENT P/B | 9.76 | ||
| CURRENT PE/ROE | 1.02 | ||
| EV/Sales | 0.00 | 0.00 | 13.91 |
| PE/ROE | – | – | – |
| D/E | 0.00 | 0.00 | 0.00 |
| Interest Coverage | NA | ||
| ROCE | 55.93% | 53.29% | 42.48% |
| ROE | 36.61% | 37.54% | 30.87% |
Quarterly Performance
| Q2 FY 2021 | Q1 FY 2022 | Q2 FY 2022 | Q-o-Q % | Y-o-Y % | |
| Revenue (In Rs. Cr.) | 255.12 | 303.17 | 331.97 | 9.50% | 30.13% |
| EBITDA (In Rs. Cr.) | 138.96 | 183.13 | 200.35 | 9.40% | 44.18% |
| EBITDA Margin | 54.47% | 60.40% | 60.35% | ||
| PAT (In Rs. Cr.) | 125.43 | 154.94 | 173.07 | 11.70% | 37.99% |
| PAT Margin | 49.16% | 51.11% | 52.13% | ||
| EPS (In Rs.) | 4.36 | 5.36 | 5.99 | 11.75% | 37.39% |
Q2 FY 2022 Highlights:
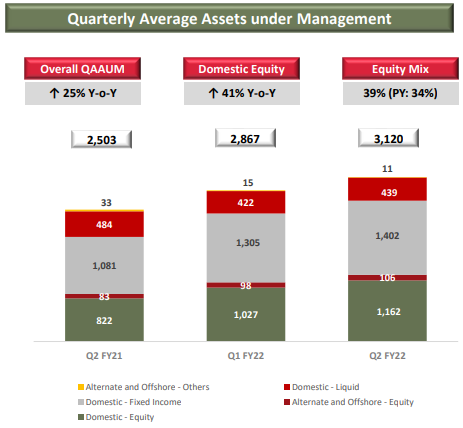
- ABSL AMC’s total QAAUM including Alternate assets stood at Rs. 3,120 billion for the quarter ending September 30, 2021.
- Equity MF QAAUM has increased by 41% YoY to Rs 1,162 billion for Q2 FY22. Equity MF mix is at 38.7% for Q2 FY22.
- Individual Monthly AAUM has increased by 29% YoY to Rs 1,431 billion for September 2021. Individual mix is at 47.2% of total AUM
- ABSL AMC serviced 7.3 million folios for the quarter ending September 30, 2021. Added around 5,95,000 new folios in H1 FY22.
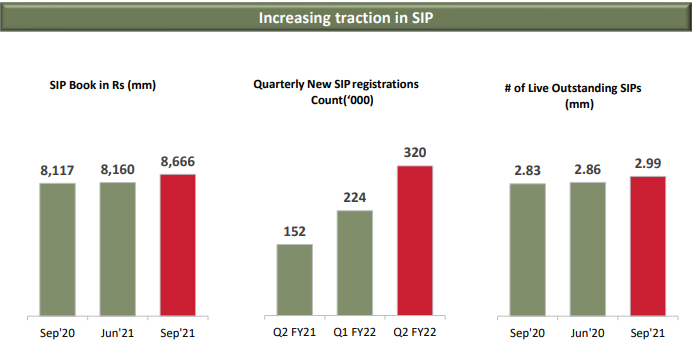
- Monthly systematic inflows for September 2021 is Rs. 8,666 million with 2.99 million accounts.
- Registered around 3,20,000 new SIP (including STP) for Q2 FY22 increase of 110% YoY.
- For H1 FY22, around 84% of overall transactions done digitally and 77% new Folios created digitally.
INVESTMENT RATIONALE
Growth Driven by Strong Systematic Flows
The Company’s individual investor MAAUM has seen growth at a CAGR of 18.38% from Rs. 546 billion. in March 2016 to Rs. 1270 billion in March 2021 and Rs. 1431 billion in September 2021. Investor folios were more than doubled from 29.3 lakh in March 2016 to 73 lakhs in September 2021, taking the market share to 9.15%. The growth in customer base and individual investor MAAUM has been largely driven by development of its digital platforms, particularly in the utilization of systematic transactions, as well as focus on building relationships with distributors, especially through deepening the B-30 cities presence. Aditya Birla AMC offers a range of systematic transaction options and add-on features including SIPs, STPs and SWPs. As of September 30, 2021, SIPs have become a material proportion of the AUM accounting for ~41.7% of total equity-oriented mutual fund AUM and ~34% of total individual investor mutual fund AUM. SIP AUM grew from 8,523 Cr. in March 2016 to Rs. 45,692 Cr. in March 2021. As of September 30, 2021, 87% of outstanding SIPs had more than 5-year vintage, while 78% of outstanding SIPs had a more than 10-year vintage depicting customer stickiness.
Focused On B-30 Penetration to Increase Customer Acquisition
Aditya Birla AMC is focused on expansion on underpenetrated B-30 cities which has helped to grow its retail customer acquisition and retention rates. The MAAUM from B-30 cities has increased by 23% YoY to Rs 481 billion for September 2021. B-30 mix is at 15.9% of total AUM. The share of equity-oriented MAAUM from B-30 cities in total equity oriented MAAUM increased from 24.51% as of March 31, 2016, to 28.82% as of September 30, 2021. As of September 30, 2021, the market share of individual MAAUM from B-30 cities was 7.8% and the market share of MAAUM from B-30 cities was 8.03%. A large part of industry growth is expected to come from B-30 cities, and AMCs with an existing large presence in B-30 cities will be well placed to attract customers in these locations due to their established position, infrastructure and distribution capabilities.
Diversified Distribution Network with Widespread Reach
The Company has established a geographically diversified pan-India distribution that is not only extensive but multi-channeled, with a significant physical as well as digital presence. As of September 30, 2021, the Company had a presence in 280+ locations, comprising 194 branches in India, spread over 27 states and 6 union territories; of these 143 branches were located in B-30 cities. Emerging Market (EM) areas are untapped markets in India that have high growth potential without material capital expenditure. Diversification of the distribution base had led to a reduction in the concentration of AUM sourced from top 10 distributors from 49% in 2016 to 37% in 2021. Mutual Find Distributor’s (MFDs), national distributors and banks/financial intermediaries contribute 30%, 15% and 9%, respectively, of the total QAAUM as of September 30, 2021, while direct marketing efforts contribute to 46%. Since 2019, the Company has added over 8000 MFDs to the distribution network. MFDs have become a significant channel for growth of equity-oriented schemes. The Company continues to expand distributor base and empanelled 1,800+ new MFDs in Q2 FY22.
The Company continues to focus on increasing its overall assets under management by growing across different asset categories. Its sustained growth in SIP book, Equity AUM, B-30 assets, folio count and differentiated product offerings have contributed towards its growth. The Company remain committed towards profitable growth by focussing further on operational efficiencies and building the business with a combination of its broader retail customer acquisition strategy, along with alternate products and enhanced services, thus catering to the needs of a wide array of investors.
The Company intends to continue to increase its footprint across India by focusing on growing its presence in B-30 cities and rural markets that remain underpenetrated and have less competition. The Company believes that entering these markets at an early stage will enable them to maximize both consumer mindshare and market share in such areas. While it continually seeks to strengthen and expand its distribution network through engagements with public/ co-operative banks and national distributors, preferably with robust online presence, the Company focuses to remain investing in and expanding its MFD network.