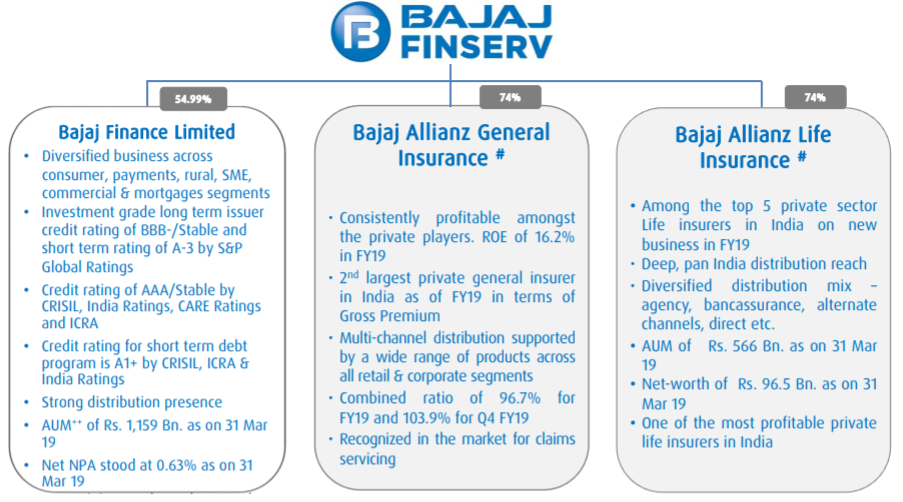
Bajaj Finserv Limited (“Bajaj Finserv” or the “Company”) is the holding company for the various financial services businesses under the Bajaj group. The Company serves millions of customers in the financial services space by providing solutions for asset acquisition through financing, asset protection through general insurance, family protection and income protection in the form of life and health insurance and retirement and savings solutions.
- Financing Business – through its 54.99% holding in Bajaj Finance Limited
- Protection business – through its 74% holding in two unlisted subsidiaries, Bajaj Allianz General Insurance Company Limited (BAGIC) and Bajaj Allianz Life Insurance Company Limited (BALIC).
Financial Position
| Particulars | FY15 | FY16 | FY17 | FY18 | FY19 |
| Revenue (In Rs. Cr.) | 7,587.01 | 9,446.40 | 24,507.17 | 30,598.87 | 42,604.00 |
| Growth | 86.26% | 24.51% | 159.43% | 24.86% | 39.23% |
| EBITDA (In Rs. Cr.) | 5,510.51 | 6,569.45 | 20,790.89 | 26,047.44 | 36,063.97 |
| EBITDA Margin | 3,280.93 | 6,738.38 | 8,712.89 | 10,964.49 | 14,917.93 |
| EBIT (In Rs. Cr.) | 43.24% | 71.33% | 35.55% | 35.83% | 35.02% |
| EBIT Margin | 3,246.15 | 3,804.05 | 4,924.53 | 6,310.17 | 8,153.38 |
| PBT (In Rs. Cr.) | 1,689.79 | 1,863.27 | 2,261.92 | 2,741.44 | 3,219.04 |
| PAT (In Rs. Cr.) | 22.27% | 19.72% | 9.23% | 8.96% | 7.56% |
| PAT Margin | 106.00 | 117.00 | 142.00 | 172.00 | 202.00 |
| EPS (In Rs.) | – | 10% | 21% | 21% | 17% |
| EPS Growth Rate | 13.34 | 14.62 | 28.86 | 30.07 | 34.42 |
| Historic P/E (Closing Price of 31st March) | 7,587.01 | 9,446.40 | 24,507.17 | 30,598.87 | 42,604.00 |
| CURRENT P/E (based on price of 7th June – Rs. 8202.35) | 40.61 | ||||
| Shareholder funds (In Rs. Cr.) | 11,089.05 | 13,598.50 | 16,150.33 | 21,182.61 | 23,765.92 |
| Minority Interest (In Rs. Cr.) | 4,225.54 | 5,876.68 | 7,200.83 | 11,047.02 | 12,807.65 |
| Debt (In Rs. Cr.) | 22,244.91 | 36,062.09 | 48,282.04 | 63,618.75 | 99,754.35 |
| Cash (In Rs. Cr.) | 1,399.58 | 2,297.52 | 1,498.67 | 1,687.78 | 1,588.89 |
| Interest Coverage | 1.47 | 2.34 | 2.34 | 2.41 | 2.28 |
| ROCE | 8.74% | 12.13% | 12.16% | 11.44% | 10.94% |
| ROE | 29.27% | 27.97% | 30.49% | 29.79% | 34.31% |
WHAT’S DRIVING THE STOCK?
Strong Brand Name | Parentage
Bajaj Finserv, a financial conglomerate under flagship brand of Bajaj, saw a sharp rise in earnings in all three business segments. General insurance is the most profitable & efficient among peers. Bajaj Finance, a niche consumer durable lender, reported earnings growth at 33-36% CAGR. BALIC enjoys a market share of ~6%.
Highlights of Group Companies
| Bajaj Finance | |||
| FY18 | FY19 | Growth | |
| AUM | 82,422 | 115,888 | 41% |
| Total Income | 12,757 | 18,502 | 45% |
| PAT | 2,496 | 3,995 | 60% |
| BAGIC | |||
| GWP | 9,487 | 11,097 | 17% |
| Investments | 14,823 | 17,237 | 16% |
| PAT | 921 | 780 | -15% |
| BALIC | |||
| GWP | 7,578 | 8,857 | 17% |
| Investments | 51,970 | 56,620 | 9% |
| PAT | 716 | 502 | -30% |
Bajaj Finance | Highest Profit Making Segment
Bajaj Finance, one of the largest retail asset financing NBFCs in India, posted solid net profit growth of 60% year -on-year (YoY) led by robust loan book growth. Bajaj Finance’s AUM grew 41% to Rs. 115,888 Cr. in Q4FY19, led by SME and consumer segment. SME grew 38% YoY to Rs. 15,759 Cr. and consumer by 45% YoY to Rs. 44,989 Cr. The Company has maintained a largely stable AUM mix – Consumer Finance: 39%, Mortgage: 29%, SME: 14%, Commercial: 10% and Rural: 8%.
Stable Asset Quality – Asset quality remained stable QoQ with GNPA ratio at 1.54% and NNPA ratio at 0.63%. Bajaj Finance’s asset-liability profile is comfortable.
Click Here – Detailed Note on Bajaj Finance
Bajaj Alliance General Insurance – Retail Focused Business Mix
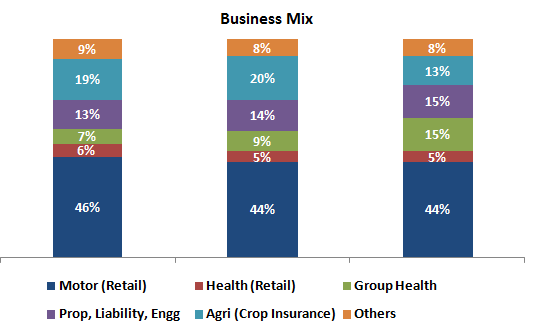
BAGIC reported robust FY19 performance with its combined ratio lowest among the peers. In addition, BAGIC is consistently amongst top 2 private insurers in terms of gross premium. Gross written premium (GWP) increased by 17% YoY driven by group health which now is the second-largest segment contributing 15% to total premium. Motor insurance continues to be largest segment with share of 44% of premium. BAGIC operates with the combined ratio of 96.7%.
Strong Financial Position
Bajaj FinServ continues to be a debt-free company with surplus funds (ex-group investments) at Rs. 7.6 billion as on 31 Mar 2019 (Rs. 6.5 Bn. as on 31 Mar 2018). The consolidated Net Worth stood at Rs. 238 Bn. (Rs. 205 Bn. as on 31 Mar 2018) and consolidated Book Value Per Share at Rs. 1,493 as on 31 Mar 2019 (Rs.1,287 as on 31 Mar 2018).
WHAT’S DRAGGING THE STOCK?
Overstretched Valuations
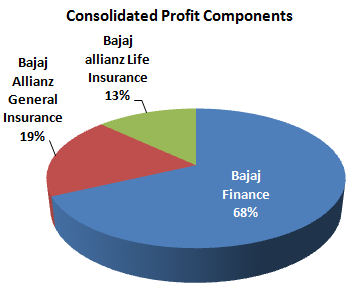
Dependence on Financing Segment – Over 65% of the profit comes from Bajaj Finance.
Muted Growth in Life Business
Absence of a strong banking partner has affected the business of Bajaj Life. The Company remains small with 2.4% market share.


