
I HAVE IN PAST ADVISED AGAINST INVESTING IN CDSL STOCK BECAUSE OF UNJUSTIFIED VALUATIONS. AT RS. 280/ SHARE, MY VIEW STANDS CHANGED. FEEL FREE TO TREAT THIS AS A RECOMMENDATION.
Incorporated in 1999, Central Depository Services (India) Limited (CDSL) (promoted by The Bombay Stock Exchange) is the leading securities depository in India. The Company offers dematerialization service for a wide range of securities including equity shares, preference shares, mutual fund units, debt instruments, government securities.
CDSL has 44% market share in terms of total demat accounts (as of end FY 2017).
The Company has also set up CDSL Ventures Limited – the 1st and largest KYC Registration Agency (KRA) in the country and CDSL Insurance Repository Limited for demat of insurance policies and CDSL Commodity Repository Limited for keeping electronic record of Electronic Negotiable Warehouse Receipts (eNWR).
- On June 30, 2017, CDSL got listed on NSE at a premium of 68% over the issue price of Rs.149.
- The stock got listed at Rs. 250 on 30th June, 2017 and on 14th July, 2017, the stock touched a high of Rs. 486.
- CMP (22nd March, 2018) – Rs. 282
Strong Profitability Margins, Healthy Return Ratios
| Particulars (In Rs. Cr.) | 2013 | 2014 | 2015 | 2016 | 2017 |
| Total Income from Operations | 90.75 | 88.93 | 105.42 | 122.85 | 146.00 |
| Expenses | 55.01 | 56.22 | 60.00 | 59.30 | 66.59 |
| EBITDA | 35.73 | 32.72 | 45.42 | 63.55 | 79.41 |
| Depreciation | 2.61 | 4.97 | 6.24 | 4.19 | 3.70 |
| Finance Costs | 0.00 | 0.00 | 0.00 | 0.00 | 0.00 |
| Other income | 33.30 | 33.89 | 21.76 | 16.58 | 40.85 |
| Exceptional items | 0.00 | 0.00 | 1.68 | 33.10 | 0.00 |
| PBT | 66.43 | 61.64 | 62.62 | 109.04 | 116.56 |
| Tax | 15.18 | 12.94 | 19.20 | 35.12 | 29.97 |
| Extraordinary Items | 0.73 | (0.85) | – | – | – |
| PAT (before Minority Interest and share of Associates) | 50.52 | 49.55 | 43.42 | 73.92 | 86.59 |
| Profit attributable to MI | 0.58 | 0.20 | 0.24 | 0.22 | (0.81) |
| Income Attributable to Consolidated Group | 49.94 | 49.35 | 43.66 | 74.14 | 85.78 |
| EPS | 4.78 | 4.72 | 4.18 | 8.71 | 8.21 |
Profitability Ratio
| Particulars | 2013 | 2014 | 2015 | 2016 | 2017 |
| EBITDA Margin (%) | 39.38% | 36.79% | 43.08% | 51.73% | 54.39% |
| Net Profit Margin (%) | 55.03% | 55.49% | 41.42% | 60.35% | 58.75% |
Balance Sheet Figures
| Particulars (In Rs. Cr.) | 2013 | 2014 | 2015 | 2016 | 2017 |
| Share Capital | 104.50 | 104.50 | 104.50 | 104.50 | 104.50 |
| Reserves & Surplus | 224.01 | 248.91 | 264.90 | 307.60 | 428.82 |
| Net worth | 328.51 | 353.41 | 369.40 | 412.10 | 533.32 |
| Non-Controlling Interest | 12.37 | 13.57 | 14.30 | 14.08 | 15.49 |
| Long Term Borrowings | 0.00 | 0.00 | 0.00 | 0.00 | 0.00 |
| Current liabilities | 53.12 | 66.26 | 85.16 | 64.45 | 57.08 |
| Other long term liabilities and provisions | 21.57 | 21.64 | 22.30 | 23.03 | 0.61 |
| Deferred tax liabilities | – | 0.11 | 0.02 | 0.00 | 0.75 |
| Total Liabilities | 415.57 | 454.99 | 491.18 | 513.66 | 607.25 |
| Particulars (In Rs. Cr.) | 2013 | 2014 | 2015 | 2016 | 2017 |
| Fixed Assets | 9.78 | 9.79 | 6.69 | 3.67 | 5.48 |
| Noncurrent Investments | 25.76 | 44.69 | 211.72 | 193.61 | 272.90 |
| Current assets | 364.96 | 383.68 | 255.36 | 294.40 | 303.78 |
| Long term advances and other noncurrent assets | 10.45 | 12.80 | 12.02 | 14.29 | 22.80 |
| Deferred Tax Assets | 4.62 | 4.04 | 5.39 | 7.69 | 2.29 |
| Total assets | 415.57 | 454.99 | 491.18 | 513.66 | 607.25 |
Efficiency Ratio
| Particulars | 2013 | 2014 | 2015 | 2016 | 2017 |
| Return on Capital Employed | 10.48% | 8.91% | 11.84% | 14.91% | 14.47% |
| Return on Equity | 15.38% | 14.02% | 11.75% | 17.94% | 16.24% |
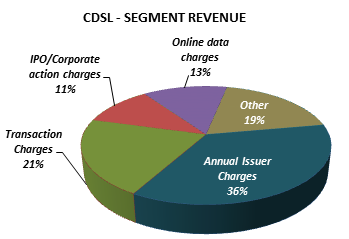
Stable/Recurring Revenue Stream
The Company has diversified offerings for its several clients which are DPs, corporate, stock exchanges, clearing corporations, registrars and investors. This has provided the company with multiple streams of stable and recurring operating revenue like income from fixed annual charges (AMC) collected from companies registered with them and transaction-based fees collection. Nearly 39% of revenues come from annual listing fees, which are steady in nature and 21% from transaction charges. On comparative basis, National Securities Depository Limited (NSDL) derives only 7% of its revenues from annual fees and 51% of revenues come from transaction charges. This lends higher revenue visibility for CDSL compared to NSDL, which is its only competitor.
Various fees/ charges levied by CDSL to DPs
| Service offered | Charges/fees (Rs.) |
| Minimum Monthly Bill | 8,000 |
| Account Maintenance charges for Corporates | 500 |
| Transaction Charges : per credit transaction into the Principle Account that originates from the Clearing House Account | 5.5 |
| Settlement Charges per month | 500 |
| Rematerialisation | Fee For every 100 securities Rs. 10 Part thereof; subject to maximum 5,00,000 Or Flat fee Rs. 10 per certificate , whichever is higher |
| Corporate Action Charges | 10 per record |
Record Growth in Number of Demat Accounts
CDSL’s number of demat accounts has grown at a CAGR of 8.6% over FY 2011-17 to 1.23 Cr., compared to 5.1% for NSDL over the same period to 1.56 Cr.
So far in FY 2017 until (March 2017), 3.76 million new Demat accounts have been opened which crosses the all-time high of 3 million accounts opened in FY 2008. Every Demat account is a future revenue stream for Depositories.
Debt Free Company and Consistent Dividend Payouts
| Year | FY 2013 | FY 2014 | FY 2015 | FY 2016 | FY 2017 |
| Dividend/Share (In Rs.) | 2.00 | 2.00 | 2.20 | 2.50 | 3.00 |
Increased Participation of Investors in Equity Market
Competition
There is no listed player in this space. CDSL competes with NSDL (National Securities Depository Limited), which commands 56% market share.
NSDL FINANCIALS
| Particulars | FY14 | FY15 | FY16 | FY17 |
| Revenue (In Rs. Cr.) | 132.47 | 159.78 | 184.51 | 185.98 |
| Growth | – | 21% | 15% | 1% |
| EBITDA (In Rs. Cr.) | 28.01 | 41.26 | 75.33 | 77.06 |
| EBITDA Margin | 21.14% | 25.82% | 40.82% | 41.43% |
| PAT (In Rs. Cr.) | 43.44 | 51.66 | 94.76 | 79.57 |
| PAT Margin | 32.79% | 32.33% | 51.36% | 42.79% |
| EPS (In Rs.) | 10.86 | 12.92 | 23.69 | 19.89 |
| EPS Growth Rate | – | 19% | 83% | -16% |
| Shareholder funds (In Rs. Cr.) | 319.21 | 358.84 | 441.56 | 471.18 |
| Debt (In Rs. Cr.) | 0.00 | 0.00 | 0.00 | 0.00 |
| Cash (In Rs. Cr.) | 79.37 | 47.76 | 48.91 | 79.25 |
|
Ratios |
||||
| D/E | 0.00 | 0.00 | 0.00 | 0.00 |
| Interest Coverage Ratio | NA | |||
| ROCE | 8.77% | 11.50% | 17.06% | 16.35% |
| ROE | 13.61% | 14.40% | 21.46% | 16.89% |
Competition from NSDL – Comparison of CDSL & NSDL
| NSDL | CDSL | |
| Market Share FY 2017 | 56% | 44% |
| Market Share FY 2014 | 60% | 40% |
| Revenue CAGR (3 year) | 12% | 11% |
| No. of Demat Account FY 2017 | 1.56 Cr. | 1.23 Cr. |
| No. of Demat Account FY 2014 | 1.31 Cr. | 0.88 Cr. |
General Risks – Slowdown in share market, change in consumer preference to some other financial products, High dependence on technology and IT services sourced from third parties.
Appointment of CERSAI as central KYC registration agency may have a significant adverse impact on the business prospects and result of operations of its subsidiary, CDSL Ventures.
I don’t know why my comment never gets published here. If my comments are disturbing you then sorry. I was never interested to show off. If any of my comments went in the wrong way then sorry. will never Comment here.
The only comments that dont get published here are the ones with bad links or off the subject 🙂 Let me know what I missed out on
What if block chain is being implemented, how would earnings get impacted
Thanks for endorsing CDSL. Was on my radar since listing, but rate was higher. Now, I will definitely buy on your recommendation.