 Cyient Limited (“Cyient” or the “Company”) provides engineering, manufacturing, geospatial, network, and operations management services to global industry leaders.
The Company specializes in Engineering, Design Led Manufacturing, Network Engineering Operations, IT Service Management, Data Management, Geospatial Solutions, Big Data Consulting, IoT/M2M and Advanced Analytics.
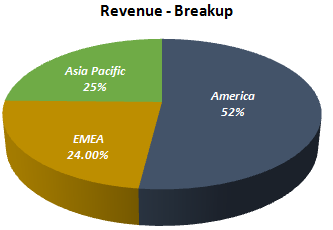
Cyient has a diversified geographical presence with 48 development centers spread across the Americas, Europe, and servicing clients in more than 20 countries. The Company has ~300 clients as of 31st March, 2019.
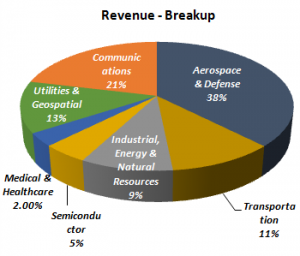
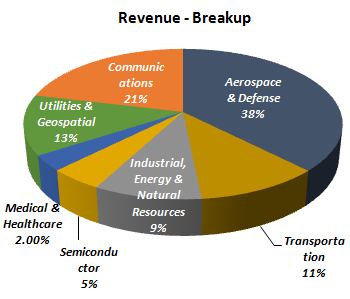
 The Company’s industry focus includes Aerospace & Defense, rail transportation, off -highway & industrial, power generation, mining, oil & gas, communications, utilities, infrastructure, geospatial and Navigation, semiconductor and medical technology & Healthcare.
Strong Clientele:
- Aerospace – Pratt and Whitney, Boeing, Airbus, Vaugh Aircraft, Bell Helicopters etc.
- Rail Transport – Bombardier, Alstom–Siemens, Thales etc
- Utilities – Southern Edison, Ausgrid etc.
- Telecom – Telstra, Airtel, NBN Broadband, Telenet etc.
- Geospatial and Mapping Services – TomTom N.V.
Financial Position
| Particulars | FY15 | FY16 | FY17 | FY18 | FY19 |
| Revenue (In Rs. Cr.) | 2,735.93 | 3,094.10 | 3,585.80 | 3,913.90 | 4,617.50 |
| Growth | – | 13.09% | 15.89% | 9.15% | 17.98% |
| EBITDA (In Rs. Cr.) | 400.83 | 414.10 | 477.20 | 535.40 | 632.80 |
| EBITDA Margin | 14.65% | 13.38% | 13.31% | 13.68% | 13.70% |
| EBIT (In Rs. Cr.) | 329.55 | 397.70 | 381.90 | 430.20 | 521.40 |
| EBIT Margin | 12.05% | 12.85% | 10.65% | 10.99% | 11.29% |
| PBT (In Rs. Cr.) | 445.55 | 408.70 | 431.80 | 556.70 | 619.30 |
| PAT (In Rs. Cr.) | 353.20 | 325.50 | 343.80 | 405.40 | 478.50 |
| PAT Margin | 12.91% | 10.52% | 9.59% | 10.36% | 10.36% |
| EPS (In Rs.) | 31.43 | 28.94 | 30.54 | 36.00 | 43.06 |
| EPS Growth Rate | – | -8% | 6% | 18% | 19.6% |
| Historic P/E (Closing Price of 31st March) | 15.97 | 14.75 | 15.31 | 19.30 | 15.14 |
| CURRENT P/E (based on price of 18th June – Rs. 560) | 13.00 | ||||
| Shareholder funds (In Rs. Cr.) | 1,844.06 | 1,830.40 | 2,117.30 | 2,343.90 | 2,564.10 |
| Minority Interest (In Rs. Cr.) | 12.23 | 6.70 | 2.60 | 0.30 | (1.90) |
| Debt (In Rs. Cr.) | 127.97 | 182.80 | 165.10 | 241.00 | 325.30 |
| Cash (In Rs. Cr.) | 622.85 | 694.90 | 878.10 | 980.70 | 970.50 |
| D/E | 0.07 | 0.10 | 0.08 | 0.10 | 0.13 |
| Interest Coverage | 69.59 | 4.66 | 27.74 | 26.25 | 19.41 |
| ROCE | 16.61% | 19.69% | 16.71% | 16.64% | 18.06% |
| ROE | 24.16% | 22.33% | 20.39% | 23.75% | 24.15% |
Quarterly Performance
| Quarterly Results | Q4 FY 2018 | Q3 FY 2019 | Q4 FY 2019 | Q-o-Q % | Y-o-Y % |
| Revenue (In Rs. Cr.) | 1,061.80 | 1,187.70 | 1,162.90 | -2.09% | 9.52% |
| EBITDA (In Rs. Cr.) | 142.00 | 174.20 | 166.60 | -4.36% | 17.32% |
| EBITDA Margin | 13.37% | 14.67% | 14.33% | ||
| PAT (In Rs. Cr.) | 118.40 | 92.30 | 176.60 | 91.33% | 49.16% |
| PAT Margin | 11.15% | 7.77% | 15.19% | ||
| EPS (Rs.) | 10.46 | 8.14 | 15.70 | 92.87% | 50.10% |
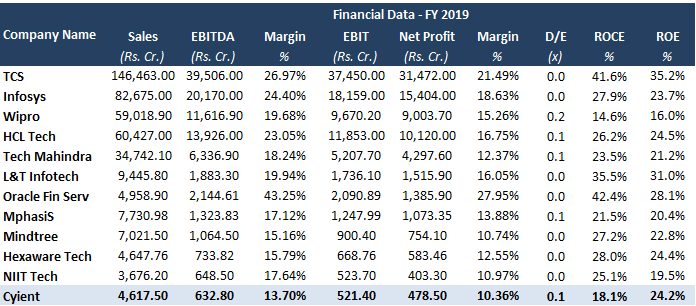
Peer Comparison
WHAT’S DRIVING THE STOCK?
New journey from Services to Solution
Cyient currently generates revenues in ratio of 80:20 from services and solutions. Management guided its focus of scaling its solution based revenues to 80% (and IT to 20%) with significant investments in developing technology focused solutions. The Company will focus on digital with IoT, AR/VR, TRM, Spacebots and Machine learning. The Management articulated its strategy to target the U.S. $93 billion spend by becoming an integral part of clients’ value chain and evolving to a solutions-led company from a services led one.
Focus on Inorganic Growth
Cyient has made nearly 28 acquisitions over last decade with success rate of ~60%. The Company’s management has guided for higher investment in FY20 with focus on creating different solutions. The management has guided for ~U.S. $ 400 million of inorganic investment and ~U.S. $ 150 million of organic investment over FY20-22E.
Healthy Order Wins And Growth
Cyient’s total order intake in FY19 grew 12% to U.S. $ 749 million and DLM stood at U.S. $ 86 million, up 34%. Healthy order wins and growth in the non-top 5 clients brings visibility of strong growth momentum going forward. Outsourcing potential in engineering/R&D (ER&D) services is high, and Cyient can be a key beneficiary.
Healthy Financial Risk Profile
Gearing is moderate at about 0.13 times as on March 31, 2019.
WHAT’S DRAGGING THE STOCK?
Management Conservative Guidance
After a guidance miss in FY19, the management has built in a conservative guidance considering demand and attrition trends. The Company expects high single digit growth for services in constant currency and ~15% for Design-Led Manufacturing business in constant currency in FY20E.
Vertical Commentary
Issues in large clients in aerospace & defence (A&D) segment and communication segment limited Q4FY19 services revenue growth. This issue is expected to continue in Q1FY20E. Improvement in growth can be witnessed from Q2FY20E onwards.
Cyient is Struggling With Issues such as (1) Single digit growth in services business, (2) Challenges in top accounts (3) Issues in core vertical (Aerospace & Defense).
Hi Rajat
Infotech Enterprises– a body shopping company from the land of Satyam – Hyderabad is now called Cyient.
Need I say more
Why not…. Please write more.