
About D-Mart IPO Issue – D-Mart IPO will open on 8 March and close on 10 March. The upcoming IPO is one of the most anticipated offers this year, primarily because the Company is promoted by Radhakishan Damani. D-Mart IPO will raise Rs. 1,870 Cr. by issuing new shares, priced in the range of Rs. 295 – 299 per share.
About Avenue Supermarts Limited (D-Mart)
View – Buy / Subscribe
Business – Avenue Supermarts Limited (“D-Mart” or the “Company”) is one of the largest and the most profitable Food & Grocery (F&G) retailer in India. The Company classifies its products under the following categories:
- Foods: This category includes staples, groceries, fruits & vegetables, snacks & processed foods, dairy & frozen products, beverages and confectionery. In FY 2016, this category contributed 53.06%, to total revenue.
- Non-Foods (FMCG): This category includes home care products, personal care and toiletries and other over the counter products. In FY 2016, this category contributed 20.58% to total revenue.
- General Merchandise & Apparel: This category includes bed & bath products, home appliances, furniture, crockery, utensils, plastic goods, garments and footwear. In FY 2016, this category contributed 26.36% to total revenue.
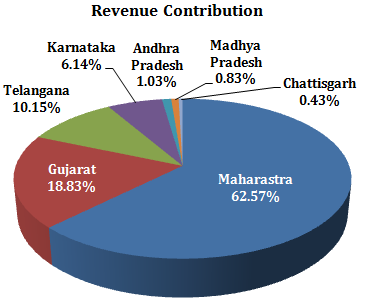
Market Presence – As of September 15, 2016, the Company operates with 112 stores, located across 41 cities in Maharashtra (58), Gujarat (26), Telangana (13), Karnataka (7), Andhra Pradesh (3), Madhya Pradesh (3), Chhattisgarh (1) and NCR (1). In June 2016, D’Mart opened a new store in Ghaziabad, NCR.
Distribution Network – the Company had a network of 21 distribution centers and 6 packing centers in Maharashtra, Gujarat, Telangana and Karnataka.
Strong Track Record of Growth and Profitability – D-Mart’s total revenue grew at a CAGR of 35.28% from Rs. 4,702.33 Cr. in FY 2014 to Rs. 8,606.11 Cr. in FY 2016. The Company’s net profit after tax grew at a CAGR of 41.08% from Rs. 161.37 Cr. in FY 2014 to Rs. 321.21 Cr. in FY 2016.
KEY FINANCIAL FIGURES
| (In Rs. Cr.) | FY2014 | FY2015 | FY2016 |
| Total Income from Operations | 4,686.49 | 6,439.43 | 8,588.12 |
| Expenses | 4,344.71 | 5,980.44 | 7,924.64 |
| EBITDA | 341.78 | 458.99 | 663.48 |
| Depreciation | 57.01 | 81.54 | 98.43 |
| Finance Costs | 55.676 | 72.361 | 90.824 |
| Other income | 15.83 | 18.25 | 17.98 |
| Exceptional items | – | 0 | 0 |
| PBT | 244.92 | 323.35 | 492.22 |
| Tax | 83.49 | 110.92 | 171.62 |
| Extraordinary Item | (0.05) | (0.69) | 0.72 |
| PAT | 161.37 | 211.73 | 321.33 |
| Minority Interest | – | 0.04 | 0.04 |
| Share in Net Loss of Associates | – | – | 0.072 |
| Net Profit/(Loss) | 161.37 | 211.69 | 321.21 |
PROFITABILITY ANALYSIS
| (%) | FY2014 | FY2015 | FY2016 |
| Operating Profit Margin Ratio | 7.29 | 7.13 | 7.73 |
| Net Profit Margin Ratio | 3.44 | 3.29 | 3.74 |
KEY BALANCE SHEET FIGURES
| (In Rs. Cr.) | FY2014 | FY2015 | FY2016 |
| Share Capital | 546.75 | 561.54 | 561.54 |
| Reserves & Surplus | 408.83 | 637.68 | 958.88 |
| Net worth (shareholders funds) | 955.58 | 1,199.22 | 1,520.43 |
| Minority Interest | 0.01 | 0.054 | 0.1 |
| Long Term Borrowings | 456.84 | 713.78 | 908.47 |
| Current liabilities | 356.188 | 395.037 | 614.988 |
| Other long term liabilities and
provisions |
12.519 | 16.213 | 16.345 |
| Deferred tax liabilities | 26.511 | 30.513 | 39.865 |
| Total Liabilities | 1,807.65 | 2,354.81 | 3,100.19 |
| (In Rs. Cr.) | FY2014 | FY2015 | FY2016 |
| Fixed Assets | 1,260.47 | 1,626.20 | 2,175.20 |
| Non-current Investments | 15.24 | 14.56 | 27.47 |
| Current assets | 489.34 | 633.68 | 789.85 |
| Long term advances and other noncurrent assets | 42.58 | 80.36 | 107.66 |
| Total assets | 1,807.65 | 2,354.81 | 3,100.19 |
EFFICIENCY ANALYSIS
| FY2014 | FY2015 | FY2016 | |
| ROCE | 24.20 | 23.99 | 27.32 |
| ROE / RONW | 16.89 | 17.66 | 21.13 |
Comparison with Listed Industry Peers
| Company | D-Mart | Future Retail | Trent |
| Price (Rs.) | [•] | 258.60 | 245.20 |
| P/E | [•] | 34.99 | 82.96 |
| Revenue (Rs. Cr.) | 8,588.12 | 6,860.47 | 2,463.51 |
| Net Profit (Rs. Cr.) | 321.33 | 14.55 | 62.94 |
| EPS (Rs.) | 5.72 | 0.66 | 19.00 |
| ROE (%) | 27.32 | 0.81 | 4.37 |
D-Mart– IPO Use of Proceeds
D-Mart has filed a Draft Red Herring Prospectus (DRHP) with SEBI for an initial public offering (IPO) to raise Rs. 1,870 Cr.
Use of Proceeds as per the DRHP
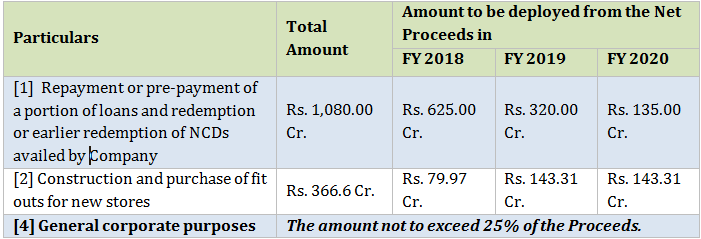
Expansion Plan – the Company intends to further increase its position in the retail supermarket business in Maharashtra and Gujarat by increasing its market presence and expanding its store network in Andhra Pradesh, Telangana, Madhya Pradesh, Karnataka, Chhattisgarh, Tamil Nadu and northern India.
Growth Prospects
Retail Basket and Consumer Spend Trends in India
Currently, the food and groceries (F&G) segment constitutes a majority share of the retail market (67%). According to Technopak, F&G will continue to be the largest contributor in the retail market even four years hence with a projected share of 66% in 2020.
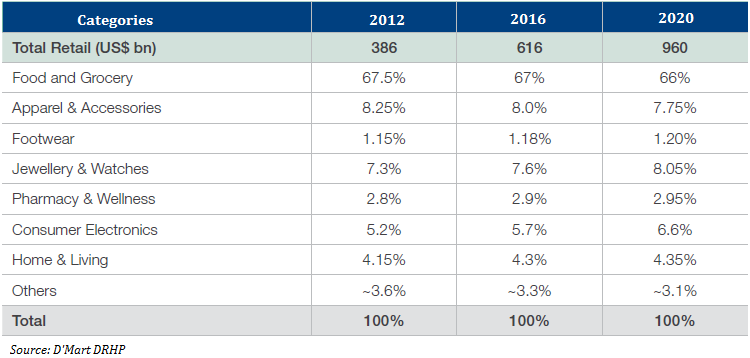
F&G segment has grown at a CAGR of 33% from U.S. $4 billion in FY 2012 to reach U.S. $13 billion in FY 2016 and is expected to grow further at a CAGR of 26% to reach at U.S. $31 billion in FY 2020.
High level of competition – The Indian retail market has become increasingly competitive in recent years and this may increase in the future. In the Foods category including groceries and staples, the Company face competition from other organized retail supermarket chains including Big Bazaar, Reliance Retail, Spencers, HyperCity, and Star Bazaar on one hand and unorganized retail kirana shops on the other.
In relation to non-food products and other products, D-Mart faces competition from organized retail chains such as Westside and Max.
Key retailers operating in the F&G segment currently hold around 37% market share of the U.S. $14 billion organized F&G market. Future group holds the largest market share with 13% owning to the group having multiple brands followed by D‘Mart at 10% and Reliance at 8%. Together, these three retailers contribute to 31% of the overall F&G segment.
Lottery system is really difficult to understand. Many investors have applied for the IPO and ended with weird expressions. Looking at the numbers, nothing was extra ordinary about it but the hype created by the investors these days for the IPO actually making it attractive. Sharing personal experience about new entrants of the stock market, even many of them want to buy IPO without analysing anything, just on the attraction of listing gains. Listing gains are actually added value in the recent past IPOs and making market more attractive in coming time as well.