In this article, I will be discussing the various stock valuation methods used to arrive at a fair value or the target price for the company. To illustrate this, I will take Reliance Industries to explain the different stock valuation methods.
[1] Stock Valuation Method – Peer Comparison
In this valuation method, we compare a company’s value to that of its peers. One of the most popular relative valuation multiples is the price-to-earnings (P/E). The P/E multiple allows to know how the stock is trading as compared to its peers.
Reliance Industries peers includes Indian Oil, BPCL, HPCL, MRPL and Chennai Petroleum. In comparison to its peers, Reliance is trading at premium.
Please note that the premium is due to the Company’s presence in retail and digital space.
| Company Name | Market Data | Valuation | ||
| Price
(Rs.) |
Market Cap
Rs. Cr.) |
EPS TTM
(Rs.) |
P/E
(x) |
|
| Indian Oil Corporation | 148.0 | 139,282.48 | 17.8 | 8.3 |
| Bharat Petroleum | 335.7 | 72,810.97 | 34.0 | 9.9 |
| Hindustan Petroleum | 249.3 | 37,988.90 | 31.5 | 7.9 |
| Mangalore Refinery | 70.5 | 12,355.82 | 3.2 | 22.2 |
| Chennai Petroleum | 252.4 | 3,757.78 | 0.1 | – |
| Reliance Industries | 1370.8 | 868,915.92 | 66.8 | 20.5 |
Based on this method, the implied value of Reliance Industries will be calculated as Industry Average PE * Reliance Industries’ EPS TTM.
[2] Stock Valuation Method – Enterprise Value/EBITDA or EV/EBIT
Enterprise Value (EV) = market capitalization + preferred shares + minority interest + debt – total cash
This valuation method is used as a valuation tool to compare the value of a company, including debt, to its EBITDA or EBIT. Just like the P/E ratio, the lower the EV/EBITDA, the cheaper the valuation for a company. It is best to use both valuation methods simultaneously.
| Company Name | Market Data | Financial Data – TTM basis | Valuation | ||
| EV
(Rs. Cr.) |
Sales
(Rs. Cr.) |
EBITDA
(Rs. Cr.) |
Margin
% |
EV/EBITDA
(x) |
|
| IOC | 203,080.44 | 519,016.80 | 35,326.09 | 6.81% | 5.7 |
| BPCL | 110,359.51 | 288,396.70 | 10,753.59 | 3.73% | 10.3 |
| HPCL | 57,219.08 | 268,068.71 | 2,909.53 | 1.09% | 19.7 |
| MRPL | 22,417.12 | 61,900.33 | 1,897.04 | 3.06% | 11.8 |
| Chennai Petroleum | 6,137.98 | 41,178.90 | 761.85 | 1.85% | 8.1 |
| Reliance Industries | 1,141,625.92 | 581,020.00 | 83,918.00 | 14.44% | 13.6 |
| Median | 10.3 | ||||
| Average | 11.1 | ||||
How to Arrive at Price per Share Using EV/EBITDA?
- Step 1 – Multiply Company’s EBITDA or EBIT with the average EV/Mutiple to find the enterprise value.
- Step 2 – Then subtract the net debt (Debt – Cash) of the company to find the equity value of the business.
- Step 3 – After that point, divide by shares outstanding to find the equity value per share.
Different Stock Valuation Methods – Reliance Industries – Click for the valuation template.
[3] Stock Valuation Method – Sum of the Parts Valuation
This valuation method is used to value a company with business segments in different industries that have different valuation characteristics. This method values each individual business of a diversified company. Later, all businesses are clubbed together to calculate the total value of the diversified company.
Depending on the nature of business, relevant multiples like P/E, EV/EBITDA, EV/ EBIT, EV/ Sales, EV/net Income can be used for valuation.
SOTP Valuation – Segment A Valuation + Segment B Valuation+ Segment C Valuation – Net Debt = Equity Value of the Company
Take for instance, Reliance Industries’ main business is oil refining and petrochemicals but the Company has also diversified into oil and gas exploration, retailing and recently telecom. This is the most appropriate method to arrive at the fair value of Reliance as it takes into account all of its businesses.
| Reliance Industries – SOTP Valuation | |||||
| Segment | Revenue (In Rs. Cr.) | EBIT (In Rs. Cr.) | Multiple (x) | Enterprise Value (In Rs. Cr.) | |
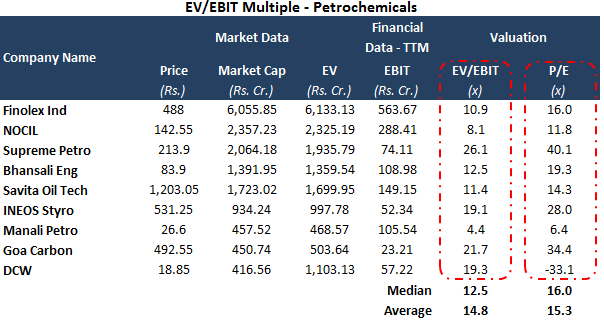
| Petrochemicals | 172,065 | 32,173 | EV/EBIT | 14.8 | 476,937 |
| Refining | 393,988 | 19,868 | EV/EBIT | 13.6 | 270,751 |
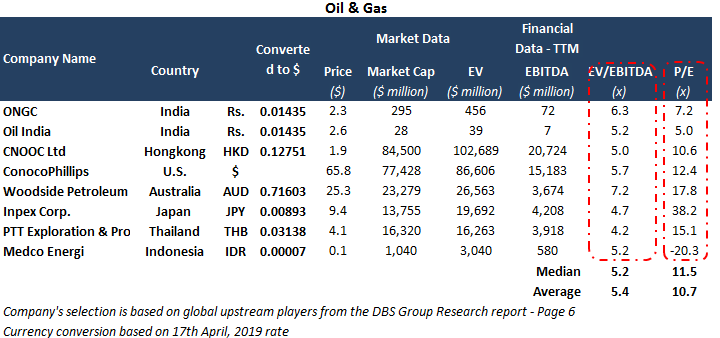
| Oil and Gas | 5,005 | 1,642 | EV/EBITDA | 5.4 | 8,914 |
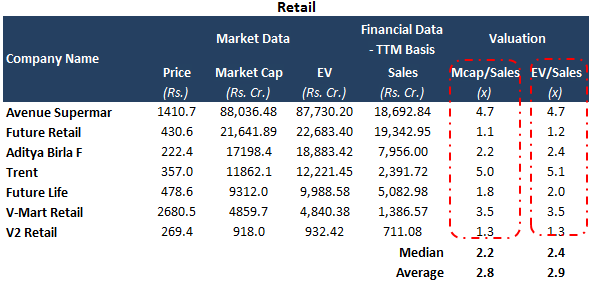
| Organized Retail | 130,566 | 5,546 | EV/Sales | 2.8 | 365,166 |
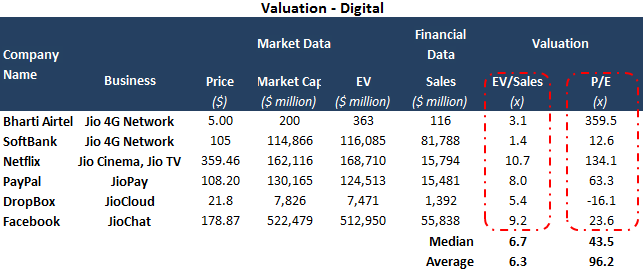
| Digital Service | 46,506 | 8,784 | EV/Sales | 6.3 | 293,245 |
| Others* | 22,151 | 1,230 | EV/Sales | 1.0 | 22,151 |
| Total Enterprise Value (In Rs. Cr.) | 1,437,164 | ||||
| Less: Net Debt (In Rs. Cr.) | 264,430 | ||||
| Debt (In Rs. Cr.) | 271,942 | ||||
| Cash (In Rs. Cr.) | 7,512 | ||||
| Market Cap (In Rs. Cr.) | 1,172,734 | ||||
| Number of Shares in Cr. (as on 31st Dec 2018) | 634 | ||||
| Price per share (Rs.) | 1,850 | ||||
*Other business segments includes media business like TV18, Network18, MoneyControl etc.
**Revenue, EBITDA and EBIT Numbers are of FY 2019.
_________________