I get a lot of questions about (i) how much should you diversify; (ii) the kind of returns which diversification can make for you and (iii) pure equity oriented mutual funds. In this post I will try to club these 3 points together. To explain things I will use a set of bellwether stocks to construct a diversified equity portfolio.
Bellwether stocks: A commonly used term in equity markets, bellwether stocks are those which lead the pack of stocks in a particular sector or industry. They indicate the current state of the sector and set the tone going forward. Interestingly the term takes its name from a castrated male sheep that lead flocks. These sheep used to wear bells to help shepherds find them in the dark or in bad weather.
| Portfolio of Bellwether Stocks | ||
| Sector | Stocks | 10 Year CAGR – Stock Price (%) |
| FMCG | ITC | 16.50 |
| Colgate | 23.32 | |
| HUL | 16.98 | |
| Asian Paints | 32.95 | |
| Banking & Finance | Kotak Mahindra Bank | 29.70 |
| Axis Bank | 25.52 | |
| HDFC | 20.11 | |
| Automobile | Tata Motors | 13.62 |
| Maruti Suzuki | 23.50 | |
| Mahindra & Mahindra | 21.20 | |
| Auto – 2 wheelers | Hero MotoCorp | 13.35 |
| Information Technology | TCS | 21.94 |
| Infosys | 13.86 | |
| Infrastructure | Larsen & Toubro | 21.07 |
| Power | NTPC | 2.09 |
| Cement | Ultratech Cement | 20.59 |
| Pharma | Cipla | 16.62 |
| Oil & Gas | ONGC | 3.81 |
| Mining | JSW Steel | 12.69 |
| Telecom | Bharti Airtel | 7.72 |
Basis of stock selection
[1] Consistently good performer in the sector – among the highest CAGR of stock price.
[2] Market Capitalization – out of the top 5 stocks in its sector in terms of market capitalization.
Note: We have taken 20 stocks, from 12 different sectors with the highest market weight-age. Among the top five stocks (by market capitalization) we exercised our discretion in selection based mainly on quality of management and corporate governance and not on how we believe these stocks will perform in future.
Portfolio Returns Based on Holding Period
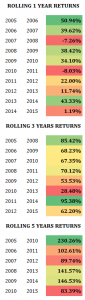
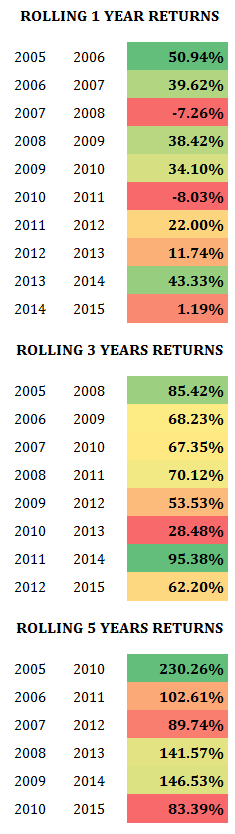 The tables on the left highlights the returns generated by investing an equal amount of cash in each of the 20 stocks in the model portfolio and holding the portfolio for – (i) 1 year, (ii) 3 years and 5 years (on a rolling basis) before selling the stocks.
Rolling basis – to explain with example, when you buy stocks for 3 years in 2005, you will hold the portfolio until 2008. In 2008, you will buy stocks at the prices prevailing in 2008 and hold those stocks till 2011.
The longer you hold the stocks, the more consistent your returns become. Keep in mind that these returns do not take into account the dividends you will receive over your holding period. A very rough estimate of dividends in this context = 1.5% of portfolio value.
The Big Takeaways
[1] Blue chips stay CONSISTENT over a longer term.On average the return generated by these stocks on:
1 year basis = 22.61%
3 year basis = 66.34%
5 year basis = 132.35%
[2] The longer you invest for, SAFER is your chance of earning a higher than fixed income investment return. To explain with an example, if the investor started investing towards the beginning of the year 2008 and sold his stocks within a year, he would have suffered a loss of 7.26%; but if the same investor continued holding on to his investment for a full 3 years, he would have made a 67.35% profit; if he continued to hold on for 5 years his returns would be 89.74%. At the same time, there are two important observations:
(i) If the investor was unfortunate enough to start at the stock market peak of 2008 when the Sensex was at ~ 22,000, he could have suffered a loss of up to 40% to his portfolio value (remember: the calculation for returns generated in the table are based on investments made on a rolling basis at the prices prevailing on 23rd September 2015. Accordingly all historic 1, 3, 5 year calculations are based on the closing prices for 23rd September of each year). Even in this case however, his investments would have turned profitable and return 67.35% (over 3 years) and 89.74% over 5 years. This perfectly highlights the ASYMMETRIC NATURE OF RETURNS in the stock markets.
(ii) TIMING THE MARKET hardly ever works. If you notice the table of returns, there is hardly any pattern to it. This approach of EARNING HIGHER THAN A FIXED DEPOSIT INVESTMENT will work ONLY for investors who plan to invest with a 3-5 year+ time horizon.
[3] Diversification, much as I am opposed to it, is the key here. Notice how power, and oil and gas have performed. Over the next 10 years, these sectors may outperform, who knows. Notice that I titled this article – diversified equity portfolio returns.
[4] Most Importantly: This works best for investors who:
(A) aim to make anything between 14-18% return (tax free and excluding 1-2% annual dividend).
(B) spread out their investments,. i.e. invest on a monthly or quarterly basis instead of making one big lump-sum investment and watching it on a monthly/ quarterly basis.
(c) do not rely on their investment amount and have other streams of income.
How much should you shuffle your portfolio?
There can hardly ever be any strict rules for this. In large part this will depend upon the type of portfolio you want to build and how much concentration risk would you like to take; you may concentrate only on 1-2 sectors like – infrastructure and / or oil and gas, or you may choose 10+ sectors to cut down your risk. Though such diversification will reduce your potential upside.
If these words are important to you – ‘safe’, ‘fixed income’ and ‘peaceful sleep’, you should diversify with at least 8-10 sectors and aim to earn 15-18% annual return over a 5 year period, and treat anything more as bonus. For such a portfolio, I don’t see why anyone would change more than 10-15% of their portfolio in any year. For the above portfolio of stocks that equates to replacing 2-3 stocks each year.
Add a few mid caps and try to go after a higher rate of annual return and things could change dramatically.