Over the last 8 years, BSE Sensex has delivered a return of ~ 24% (i.e. from 21,206 in January 2008 to 26,392 on 28 January 2015). Yes, since 2008 (pre-crash levels), bench-marked Indian stocks have risen by approximately 24%.
8 years for a meager 24% return is disappointing to say the least. Even a simple fixed deposit in a bank would have delivered 100% return during the same time (considering 9% interest rate compounded quarterly). Most of this 24% return came in the past 16 months, i.e. since April 2014. As everything seemed like it was getting back on track for equities, there started worries of slowdown in China and the U.S. markets peaking. Europe of course has not started showing any improvement in production. To make matters worse, Middle East has started withdrawing funds from around the world due to softening of crude prices.
With a rather gloomy picture being projected by most analysts, we decided to do some analysis of Nifty companies to compare them on 3 parameters: (1) Market capitalization; (2) Debt and (3) Earnings growth, based on metrics from 2008 and 2015.
Market Capitalization
Data in the table below compares the current market capitalization of the constituent companies of the CNX Nifty 50 Companies with their market capitalization on 1 January 2008 (excluding banking companies and HDFC).
Note: Companies marked in red indicate those where current market capitalization is less than current debt.
| Company | FY 2008 (In Rs. Cr.) | FY 2015 (In Rs. Cr.) | % Change |
| TCS | 1,03,192 | 5,03,520 | 388% |
| Reliance Ind | 4,61,007 | 2,82,132 | (39%) |
| ITC | 87,295 | 2,62,807 | 201% |
| Infosys | 1,00,475 | 2,55,122 | 154% |
| Coal India | 2,16,241 | 2,25,747 | 4% |
| Sun Pharma | 28,844 | 2,12,963 | 638% |
| ONGC | 2,67,256 | 2,08,369 | (22%) |
| Hindustan Unilever | 47,194 | 1,85,421 | 293% |
| Larsen & Toubro | 1,29,224 | 1,50,459 | 16% |
| Bharti Airtel | 1,93,386 | 1,44,806 | (25%) |
| Wipro | 76,401 | 1,39,054 | 82% |
| HCL Tech | 22,728 | 1,33,581 | 488% |
| Maruti Suzuki | 29,959 | 1,27,115 | 324% |
| Tata Motors | 47,926 | 1,15,588 | 141% |
| NTPC | 2,11,744 | 1,00,265 | (53%) |
| Lupin | 5,626 | 83,837 | 1390% |
| Asian Paints | 10,899 | 82,136 | 654% |
| UltraTech Cement | 27,214 | 80,807 | 197% |
| MNM | 26,858 | 76,565 | 185% |
| Bosch | 15,997 | 74,283 | 364% |
| Power Grid Corp | 12,307 | 71,271 | 479% |
| Dr. Reddy’s Lab | 76,669 | 70,417 | (8%) |
| BPCL | 8,746 | 65,663 | 651% |
| Bajaj Auto | 18,793 | 62,250 | 231% |
| BHEL | 1,26,514 | 57,421 | (55%) |
| Idea Cellular | 49,248 | 55,330 | 12% |
| Cipla | 16,998 | 52,985 | 212% |
| Tech Mahindra | 27,381 | 49,641 | 81% |
| Hero MotoCorp | 13,944 | 47,944 | 244% |
| NMDC | 1,91,817 | 39,925 | (79%) |
| Zee Entertainment | 15,516 | 37,169 | 140% |
| GAIL (India) | 45,890 | 36,760 | (20%) |
| Ambuja Cements | 23,038 | 31,985 | 39% |
| Grasim Ind | 34,559 | 31,892 | (8%) |
| Vedanta | 32,801 | 28,565 | (13%) |
| Cairn India | 46,478 | 27,232 | (41%) |
| ACC | 19,453 | 25,730 | 32% |
| Tata Steel | 90,634 | 22,192 | (76%) |
| Hindalco | 40,383 | 16,881 | (58%) |
| Tata Power | 40,437 | 16,512 | (59%) |
| Total | 3,041,072 | 4,292,342 | 41% |
Data in the table below compares the current total debt of the constituent companies of the CNX Nifty 50 Companies with their debt position in FY 2008 (excludes banking companies and HDFC).
DEBT
| Company | FY 2008 (In Rs. Cr.) | FY 2015 (In Rs. Cr.) | % Change |
| Reliance Ind | 50,696 | 1,48,742 | 193% |
| NTPC | 31,944 | 94,003 | 194% |
| Larsen & Toubro | 12,316 | 82,267 | 568% |
| Power Grid Corp | 22,263 | 80,472 | 261% |
| Vedanta | 0 | 71,966 | – |
| Tata Steel | 18,022 | 71,579 | 297% |
| Tata Motors | 11,585 | 69,211 | 497% |
| Hindalco | 32,352 | 67,058 | 107% |
| Bharti Airtel | 9,602 | 66,367 | 591% |
| ONGC | 944 | 45,588 | 4729% |
| Tata Power | 9,203 | 38,713 | 321% |
| BPCL | 15,100 | 32,799 | 117% |
| Idea Cellular | 6,515 | 18,776 | 188% |
| GAIL (India) | 3,785 | 15,927 | 321% |
| Grasim Ind | 5,577 | 9,142 | 64% |
| Wipro | 4,485 | 7,715 | 72% |
| UltraTech Cement | 1,741 | 7,557 | 334% |
| BHEL | 167 | 4,621 | 2667% |
| Dr. Reddy’s Lab | 1,968 | 3,617 | 84% |
| MNM | 10,357 | 2,620 | (75%) |
| Sun Pharma | 144 | 2,489 | 1628% |
| Cipla | 581 | 1,702 | 193% |
| Tech Mahindra | 30 | 675 | 2149% |
| Lupin | 1,203 | 471 | (61%) |
| Asian Paints | 258 | 410 | 59% |
| HCL Tech | 55 | 406 | 639% |
| Coal India | 1,884 | 402 | (79%) |
| Maruti Suzuki | 900 | 331 | (63%) |
| TCS | 455 | 300 | (34%) |
| ITC | 225 | 256 | 14% |
| Bajaj Auto | 1,346 | 112 | (92%) |
| Hero MotoCorp | 132 | 100 | (24%) |
| Bosch | 264 | 56 | (79%) |
| Hindustan Unilever | 434 | 43 | (90%) |
| Ambuja Cements | 289 | 22 | (92%) |
| Zee Entertainment | 387 | 1 | (100%) |
| ACC | 482 | 0 | (100%) |
| Cairn India | 4,356 | 0 | (100%) |
| NMDC | 0 | 0 | NA |
| Infosys | 0 | 0 | NA |
| Total | 2,62,047 | 9,46,514 | 261% |
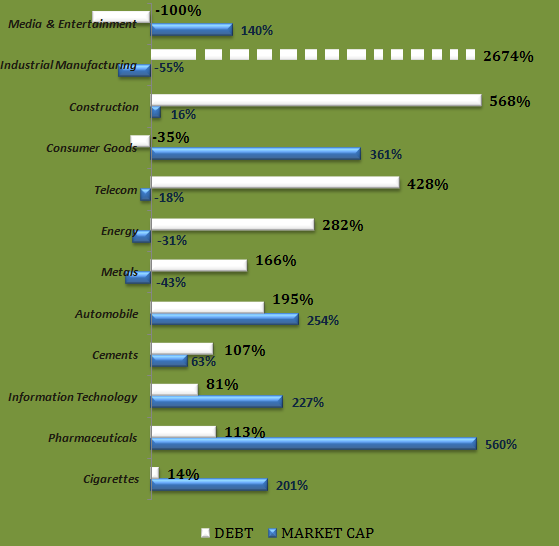
Sector Breakup: Growth in Market Capitalization and Debt
 Result of Analysis
- While market capitalization has increased 1.41 times from 2008; debt has risen by 3.61 times.
- While share prices have not increased during the 8 year period under analysis, companies have continued spending on capacity expansion.
- Debt has grown 2.5 times compared to market capitalization, indicating that companies are adding capacities in anticipation of rising demand. This is a pattern seen repeatedly before both – major bull and bear phases in past.
- Capital expenditure has been funded by debt more than equity primarily because of lack of interest in equities.
- When we looked beyond the Nifty 50 companies – many companies had interests covers below 1, indicating that they are not making enough profits to pay interest costs on their debt. Over the next 8-16 quarters, some companies out of the BSE500 will be declared bankrupt.
Also see: Interest Coverage Ratio
Earnings Growth for Nifty Companies
Net Profit
| Company | FY 2008 (In Rs. Cr.) | FY 2015 (In Rs. Cr.) | % Change |
| Reliance Ind | 19,523 | 23,640 | 21% |
| TCS | 5,060 | 20,060 | 296% |
| ONGC | 20,221 | 18,334 | (9%) |
| Tata Motors | 2,235 | 14,060 | 529% |
| Coal India | 5,243 | 13,727 | 162% |
| Infosys | 4,659 | 12,373 | 166% |
| NTPC | 7,470 | 9,992 | 34% |
| ITC | 3,178 | 9,766 | 207% |
| Wipro | 3,252 | 8,714 | 168% |
| HCL Tech | 1,054 | 6,508 | 517% |
| NMDC | 3,251 | 6,422 | 98% |
| Bharti Airtel | 6,495 | 5,308 | (18%) |
| Power Grid Corp | 1,448 | 5,046 | 248% |
| Larsen & Toubro | 2,258 | 4,934 | 119% |
| BPCL | 1,913 | 4,807 | 151% |
| Sun Pharma | 1,551 | 4,541 | 193% |
| Cairn India | 803 | 4,480 | 458% |
| Hindustan Unilever | 2,510 | 4,376 | 74% |
| Maruti Suzuki | 1,790 | 3,791 | 112% |
| Idea Cellular | 1,042 | 3,193 | 206% |
| GAIL (India) | 2,761 | 3,071 | 11% |
| Bajaj Auto | 726 | 2,812 | 287% |
| MNM | 1,845 | 2,593 | 41% |
| Lupin | 408 | 2,444 | 499% |
| Grasim Ind | 3,346 | 2,427 | (27%) |
| Hero MotoCorp | 968 | 2,349 | 143% |
| Dr. Reddy’s Lab | 437 | 2,336 | 435% |
| Tech Mahindra | 326 | 2,256 | 592% |
| UltraTech Cement | 1,012 | 2,102 | 108% |
| Ambuja Cements | 1,390 | 1,487 | 7% |
| BHEL | 3,115 | 1,450 | (53%) |
| Asian Paints | 428 | 1,427 | 233% |
| Bosch | 634 | 1,338 | 111% |
| Cipla | 701 | 1,254 | 79% |
| ACC | 1,100 | 1,151 | 5% |
| Zee Entertainment | 416 | 976 | 135% |
| Tata Power | 1,177 | 409 | (65%) |
| Hindalco | 2,624 | 84 | (97%) |
| Tata Steel | 12,322 | (3,956) | (132%) |
| Vedanta | 1,549 | (11,373) | (834%) |
| Total | 1,32,241 | 2,00,709 | 52% |
Corporate earnings for Nifty companies has grown only 1.5 times over the past 8 years, resulting in lack of interest in equities. While lack of interest was to be blamed for not buying into Indian stocks until April 2014 when price to earnings ratio of Nifty was at 18.91, today the situation is vastly different with the Nifty PE ratio at 22.17 (as of 31st August 2015).
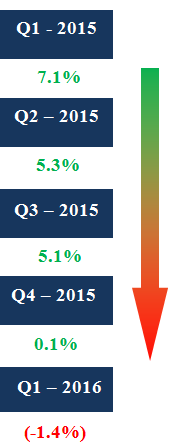 Since April 2014, while stock prices are constantly rising, corporate earnings have been falling consistently, that’s a fall for 4 straight quarters.
Also See: Nifty Results Analysis Q1 – 2016
The last time we witnessed negative earnings growth in 4 consecutive quarters before Q1 of 2016 was way back in Q2 of 2010.
Key Takeaways
- Companies within the Nifty basket with manageable debt levels will continue to generate higher returns.
- While many mid- small cap companies are struggling with high debt burden, most buying opportunities also exist in this space. Stocks outside of the BSE 500 are available at significantly discounted value.
- Big data points to look out for – Industrial production, VISIBLE IMPROVEMENT IN CORPORATE EARNINGS IS NEEDED for balance of FY 2016.
- Higher proportion of debt compared to equity is good only when companies are able to consistently earn profits higher than their interest costs. This is not the situation for most companies with high levels of debt.Also See: How higher debt helps profitability
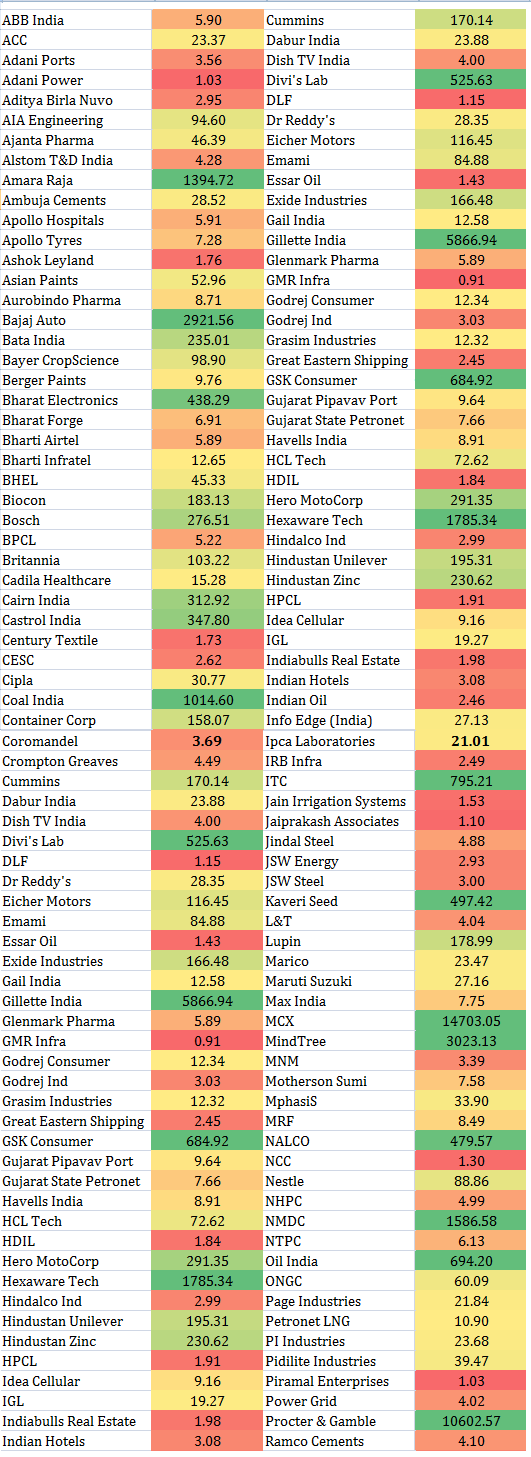
- STAY AWAY FROM COMPANIES WITH HIGH DEBT. When the economy picks up, companies which have relied less on debt funding are likely to benefit more than their debt binging counterparts who will spend most of their (potential) future earnings on servicing their interest costs. This is particularly true given that an economic recovery is most likely to happen at a very slow pace. The chart below displays the interest coverage ratio for BSE 200 Companies (excludes banking and financial service companies).
Average Interest Cover for BSE 200 Companies
One of the best analysis I have read in recent times. Keep up the good work. The bubble was built by the so called analysts for too long and it had to burst and it did. Hope Nifty does not go below 7600. What has been your target?
I am still positive on this:
http://194.195.112.90/sensex-target-40000-60000-level-by-2020/
Curiously !!! You Said “While share prices have not increased during the 8 year period” How did the sensex reached from x to y being y>x in same period.
I am the curious reader.
Part of this is also index management but sure – its not like prices have not increased at all.