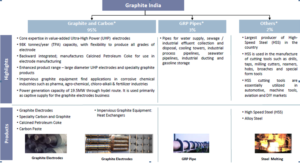
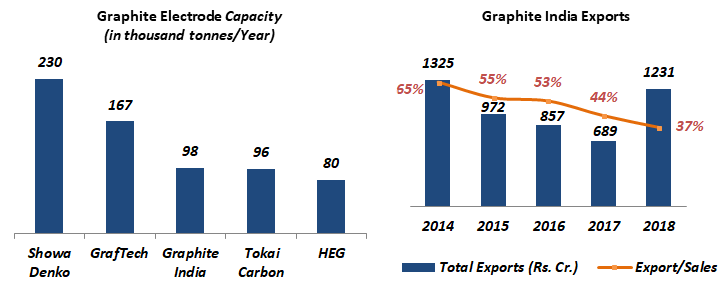
Graphite India Limited (“Graphite India” or the “Company”) is the largest Indian producer of graphite electrodes* and one of the largest globally, by total capacity.
Graphite India manufactures full range of graphite electrodes with focus on higher margin, large diameter, ultra-high power (“UHP”) electrodes.Graphite India also manufactures Calcined Petroleum Coke for use in electrode manufacturing. The Company has facilities designed for the manufacture of impervious graphite equipment and glass reinforced plastic pipes and tanks. It has an installed capacity of 19.5 MW of power generation through hydel route.
Exports account for 37% of FY 2018 total revenues.
*Graphite electrode is a key component for electric arc furnaces (EAFs) that turn scrap into steel.

DIVERSIFIED CUSTOMER BASE
- India – Essar Steel, Jindal Steel and Power, JSW Steel, Steel Authority of India, Tata Iron & Steel
- North America – Nucor Group, SDI Group, SSAB, Sterling Steel
- Mexico – Exiros
- Middle East – Diler and Yazici, Qatar Steel, Emirates Steel, EZDK, Kuwait Steel, Jindal Shadeed, SABIC
- South East Asia and Far East – PTCT Indonesia, Hyundai Steel Korea, Toyko Steel Japan, Yusco Taiwan
MANUFACTURING FACILITIES – The Company operates with a manufacturing capacity of 98,000 tonnes per annum.
| Plant Location | Capacity (MT/Year) |
|
| Durgapur (India) | 54,000 | |
| Bangalore (India) | 13,000 | |
| Nashik (India) | 13,000 | |
| Nurnberg (Germany) | 18,000 |
Financial Position
| Particulars | FY14 | FY15 | FY16 | FY17 | FY18 |
| Revenue (In Rs. Cr.) | 2,009.28 | 1,710.66 | 1,532.27 | 1,554.24 | 3,265.98 |
| Growth | – | -14.86% | -10.43% | 1.43% | 110.13% |
| EBITDA (In Rs. Cr.) | 250.10 | 136.75 | 134.59 | 126.03 | 1,444.15 |
| EBITDA Margin | 12.45% | 7.99% | 8.78% | 8.11% | 44.22% |
| EBIT (In Rs. Cr.) | 192.00 | 93.21 | 85.39 | 79.64 | 1,392.53 |
| EBIT Margin | 9.56% | 5.45% | 5.57% | 5.12% | 42.64% |
| PBT (In Rs. Cr.) | 212.78 | 106.88 | 125.37 | 71.75 | 1,472.99 |
| PAT (In Rs. Cr.) | 129.89 | 57.59 | 82.82 | 70.46 | 1,032.00 |
| PAT Margin | 6.46% | 3.37% | 5.41% | 4.53% | 31.60% |
| EPS (In Rs.) | 6.65 | 2.95 | 4.24 | 3.61 | 52.82 |
| EPS Growth Rate | – | -56% | 44% | -15% | 1364.7% |
| Historic P/E (Closing Price of 31st March) | 13.39 | 28.17 | 16.95 | 31.08 | 13.75 |
| CURRENT P/E (based on price of 31st January – Rs. 565.55) | 3.72 | ||||
| D/E | 0.24 | 0.17 | 0.17 | 0.14 | 0.10 |
| Interest Coverage | 10.47 | 8.64 | 14.23 | 15.97 | 178.73 |
| ROCE | 8.80% | 4.55% | 4.09% | 3.76% | 46.36% |
| ROE | 12.09% | 6.12% | 7.01% | 3.86% | 53.92% |
- One of the most important change for the Company in FY 2018 was the phased closure of certain blast and induction furnace capacities in China in order to curb pollution and comply with international environmental standards.
- An aggressive anti-pollution campaign in China resulted in the shutdown of ~ 200,000 MT electrodes capacity of the country.
- The closure of high polluting graphite plants in China and increasing demand for electrode from existing and new EAF plants resulted in a massive rise in graphite electrode prices.
- Prices of the graphite electrodes (finished product for Graphite India; used to melt steel) had moved up from $3,000 per tonne to Rs 15,000 per tonne over the past 15 months.
- For Graphite India, FY 2018 was marked by strong profitability on the back of higher realisations and healthy capacity utilisation levels. The average consolidated capacity utilisation level came in at 85% (vs. 74% in FY 2017).
| Quarterly Results | Q2 FY 2018 | Q1 FY 2019 | Q2 FY 2019 | TTM | Q-o-Q % | Y-o-Y % |
| Revenue (In Rs. Cr.) | 528.00 | 1,965.00 | 2,345.00 | 6,657.98 | 19.34% | 344.13% |
| EBITDA (In Rs. Cr.) | 144.00 | 1,436.00 | 1,640.00 | 4,338.15 | 14.21% | 1038.89% |
| EBITDA Margin | 27.27% | 73.08% | 69.94% | |||
| PAT (In Rs. Cr.) | 103.00 | 957.00 | 1,113.00 | 2,969.00 | 16.30% | 980.58% |
| PAT Margin | 19.51% | 48.70% | 47.46% | |||
| EPS (Rs.) | 5.25 | 49.08 | 56.87 | 152.01 | 15.87% | 983.24% |
Q2 FY 2019 Highlights:
- The Company’s strong performance is driven by both higher capacity utilization levels of 93% and improved price realizations.
- Utilization at the consolidated level stood at 93% for Q2 FY 2019, up from 81% in Q2 FY 2018 and 88% in Q1 FY 2019.
WHAT’S DRIVING THE STOCK?
Graphite Electrodes Industry | Healthy Demand Prospects
The global demand for graphite electrodes is robust as the steel industry worldwide shifts towards more efficient Electric Arc Furnace route. With China shutting down excessively polluting steel production by basic oxygen furnace/induction furnace routes, the environment friendly electric arc furnace route gained market share from 25% in 2015 to 28% in 2017.
On the back of stringent pollution control norms, China is aiming to increase the share of EAF route of steelmaking in its total steel production to 20% by 2020 (from 9% in CY17). In addition, China is likely to commission ~60-70 MT of EAF capacity in CY18.
With an annual production capacity of 98,000 MT, Graphite India is well-positioned to benefit from the growing demand for graphite electrodes.
Globally Well Positioned
Graphite India is 3rd largest graphite electrode manufacturer in the world. The Company accounts for ~12.6% of capacity among leading global electrodes manufacturers.
Strong Leverage Profile
Graphite India currently has a conservative leverage profile with significant financial capacity for organic or inorganic expansion.
| (In Rs. Cr.) | Dec-17 | Mar-18 | Jun-18 | Sep-18 |
| Total Debt | 356 | 272 | 218 | 265 |
| Cash & Cash Equivalents | 1,055 | 1,263 | 1,741 | 2,298 |
| Net Cash | 699 | 991 | 1,523 | 2,033 |
Geographically Diversified Customer Base
The Company has a geographically diversified customer base and exports Graphite Electrodes to the Middle East, Europe, USA and the South East Asia.
WHAT’S DRAGGING THE STOCK?
Higher Cost of Needle Coke*
The cost of needle coke rose to its highest in five years at $1,440 a tonne in quarter ended June 2018 and is expected to reach $3,500 by March 2019 (So
urce: Jefferies). Needle coke production is limited to a few suppliers, the biggest being U.S. oil major ConocoPhillips followed by Japan’s C-Chem Co Ltd. The needle coke industry is oligopolistic, with top 5 major players accounting for over 80% of the world’s capacity. During the quarter ended September 2018, the impact of higher needle coke cost partially impacted EBITDA margin
*Needle coke is used in lithium ion batteries, besides making graphite electrodes for electric arc furnaces that turn scrap into steel.
Reasons for Recent Sharp Fall in Stock Price Since November 2018
- Fall in steel prices and possible expectation of a slowdown in demand at a global level in steel
- Rise in the needle coke contract rises
- Continuation of graphite electrode exports from China.The graphite electrode exports from China have gone up by 20% year-on-year (YoY) in CY 2018
- Indian graphite electrode producers had stopped exporting to Iran in the December quarter while awaiting clarification on exemption from U.S. sanctions. Iran is key export destination which accounts 8-10% of combined volumes for Graphite India
Restarting of Chinese Capacity is the biggest threat to the industry.
Exposure to volatility in the global steel industry
Graphite India remains exposed to the volatility in the global steel industry, particularly to the health of the steel manufacturers manufacturing through the electric arc furnace (EAF) route.
At current levels graphite India is a buy?
good analysis of Graphite India Stock ……