
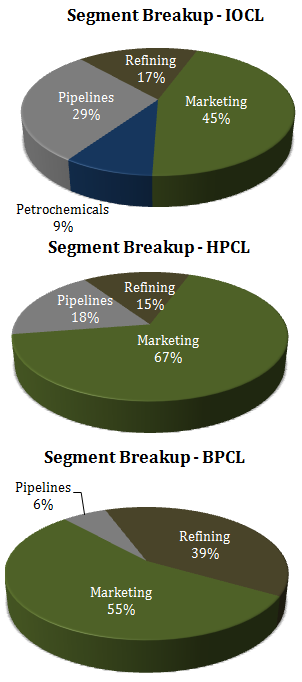
In India there are 3 big Oil Marketing Companies (OMCs): Indian Oil Corporation (IOCL), Hindustan Petroleum Corporation Limited (HPCL), and Bharat Petroleum Corporation Limited (BPCL).
Core Business: Marketing of oil.
In addition to pure marketing, these companies also refine and market oil that they buy from upstream oil exploration and production companies including from ONGC, Oil India, Reliance Industries, Cairn India etc. Their purchase price is directly related to international crude price. Thus lower prices are actually positive for oil marketing companies.
 OMC revenues will improve if oil price continues to fall as this results in (i) reduction in their purchase price (of crude oil) (ii) improves refining margins i.e. difference between the price of what refineries produce and the price of crude oil; (iii) improves marketing margins.
OMCs are not free to decide their selling price but instead they are compelled to sell the products (petrol, diesel etc) at discounted rates.
Under Recoveries – The difference between OMCs purchase price and the discounted rates i.e. actual selling price realized (excluding taxes, dealer commission) represents ‘under-recoveries’ of OMCs. This amount of under recovery is paid to the OMCs by the Government of India.
Note: Much is made about under recoveries for OMCs both in terms of government losses and how it is good for stock prices of OMCs. The truth is that post deregulation, OMCs are now incurring under recoveries only on the sale of, PDS kerosene and domestic LPG. Price of petrol was made market determined effective June 26, 2010, there is no under recovery related subsidy payment for petrol by the government since then. The price of diesel has also been completely deregulated effective October 19, 2014. However, the Government has increased excise and VAT on petrol, diesel and other oil products to keep the retail prices much higher than the price of not only crude oil but also that of the refined petrol and diesel.
Decoding the Under Recoveries Myth
BEFORE DEREGULATION OF DIESEL PRICES (MARCH 2014)
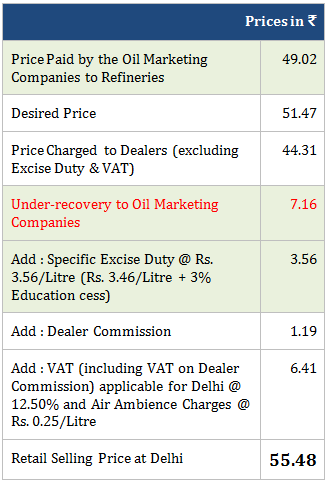 Before deregulation, OMCs were losing Rs. 7.16/Litre on diesel whereas the government was earning Rs. 9.97/Litre in the form of Excise Duty and VAT.
Out of this tax, the government reimbursed OMCs Rs. 7.16/Litre, earning only Rs. 2.81/Litre in taxes.
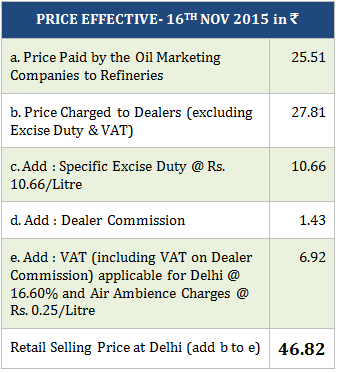
AFTER DEREGULATION OF SUBSIDY
DIESEL (Rs. /Litre)
PETROL (Rs. /Litre)
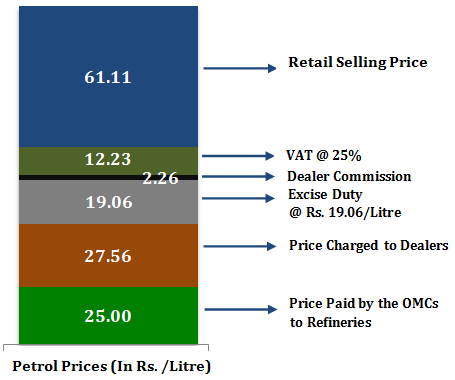 After deregulation of diesel and petrol, government earns a net of Rs. 17.58/Litre on diesel and Rs. 31.29/Litre on petrol.
ALSO SEE: CHART AT THE END SHOWING PROPORTION OF CHANGE IN EXCISE DUTY VIS-A-VIS CRUDE OIL PRICE
MARKETING DILEMMA: WHY I AM FOREVER NEGATIVE ON OIL MARKETING COMPANIES (OMC BUSINESS)
Problem – Any excess consumption of petrol and diesel is ultimately detrimental to the environment. This means that they cannot advertise their products beyond a point. Ideally, a marketing team’s mandate should be to SELL, SELL AND SELL. This is not the case here.
Oil Marketing Companies are in a zone of ‘Restricted marketing’. NOTE that OMCs earn most of their revenue from marketing.
This leaves little room for growth. They can neither market to expand the market size which basically grows on its own (with growth in population); nor can they decide their selling price i.e. the marketing margin is determined by the Government keeping ‘public popularity perception’ in mind.
In order to create their brand awareness and to intensify their sales, oil marketing companies launch a host of sales promotional schemes like discounts, loyalty programs and media commercials. All this is meant to fight each other and to earn a higher market share than their competitor (there are only 3 players in the space, each Government owned!).
Comparative Financial Performance of Indian Oil Marketing Companies (FY 2015) Figures in Rs. Crores.
| Particulars | IOCL | BPCL | HPCL |
| Revenue | 4,49,509 | 2,42,599 | 2,16,594 |
| Operating Profit | 10,536 | 9,778 | 4,694 |
| PAT | 4,912 | 4,807 | 1,499 |
| EPS | 20.23 | 66.47 | 44.25 |
| Net Worth | 68,832 | 22,562 | 13,924 |
| Total Debt | 36,796 | 19,342 | 28,536 |
| Operating Profit Margin (In %) | 2.34 | 4.03 | 2.17 |
| Net Profit Margin (In %) | 1.08 | 2.09 | 0.69 |
| ROCE (In %) | 16.25 | 22.64 | 11.03 |
| ROE (In %) | 10.43 | 21.30 | 10.76 |
| Interest Coverage Ratio | 2.52 | 8.28 | 2.56 |
| Current Ratio | 0.97 | 0.90 | 1.09 |
| Debt/Equity Ratio | 0.53 | 0.81 | 2.03 |
Indian Oil Financial Performance (in Rs. Crores)
| Particulars | FY 2013 | FY 2014 | FY 2015 |
| Revenue | 461,780 | 488,345 | 449,509 |
| Operating Profit | 13,768 | 17,057 | 10,536 |
| PAT | 4,449 | 7,086 | 4,912 |
BPCL Financial Performance (in Rs. Crores)
| Particulars | FY 2013 | FY 2014 | FY 2015 |
| Revenue | 242,181 | 264,407 | 242,599 |
| Operating Profit | 6,672 | 9,359 | 9,778 |
| PAT | 1,881 | 3,911 | 4,807 |
HPCL Financial Performance (in Rs. Crores)
| Particulars | FY 2013 | FY 2014 | FY 2015 |
| Revenue | 216,154 | 234,159 | 216,594 |
| Operating Profit | 4,173 | 5,273 | 4,694 |
| PAT | 501 | 1,080 | 1,499 |
CONCLUSION
There is no game here, Its much ado about nothing – Stock price of OMCs are inversely related to crude oil prices and will always move in line with crude oil prices. This means that they will remain in a range which could be 20-40% lower/ higher than percentage change in crude oil prices.
Source: Petroleum Planning & Analysis Cell
If at all they fall below or rise above that range, it may well be on account of ‘market perception’ and ‘economic environment’.
Falling crude oil prices have benefitted the Indian OMCs as their borrowings have declined 36 % from Rs 1, 38,749 Cr. in FY 2014 to Rs 99,681 Cr. in FY 2015.
(Source – Petroleum Planning & Analysis Cell | Snapshot of India’s Oil & Gas data | October 2015).
The result is clear in their stock price performance below:
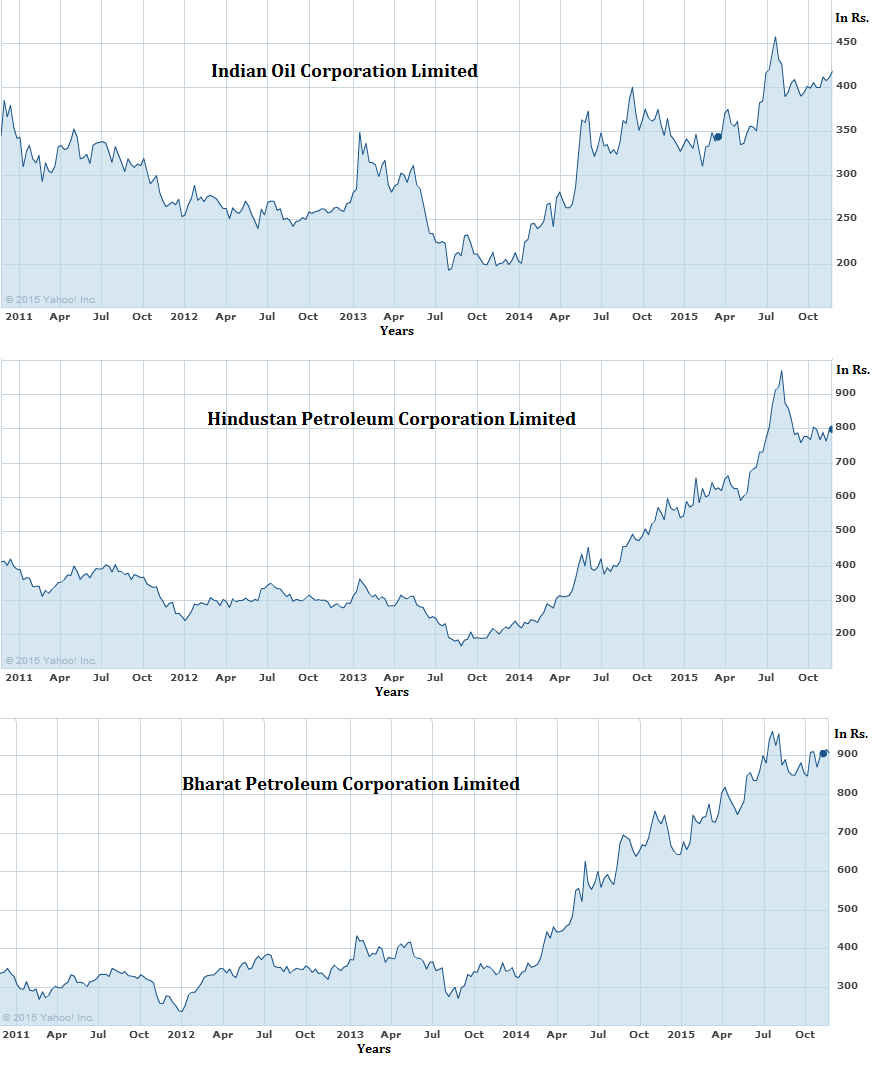
Shares of OMCs rose significantly over the last one year period. HPCL witnessed its share prices jump 53.59 %, BPCL and Indian Oil rose by 26.21 % and 22.19 % respectively.
Note:
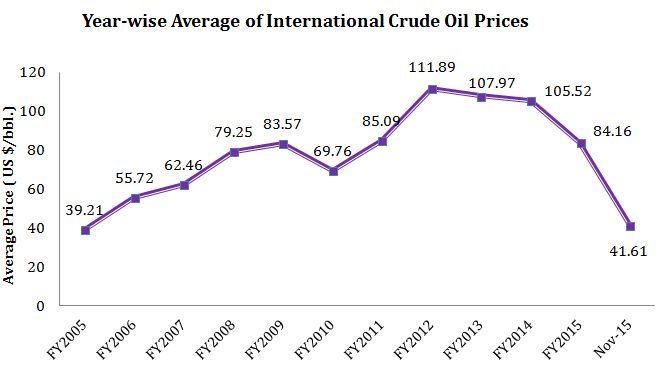
Crude oil price is down 48 % in the last one year period (U.S. $78.27 on November 24, 2014 and U.S. $41.61 on November 24, 2015). This has not trickled down to retail prices with the price of petrol down only by 6% and that of diesel by down only 13%.
| Year | Crude Prices
(US $/bbl.) |
Petrol Prices
(Rs./Litre) |
Diesel Prices
(Rs./Litre) |
| FY2005 | 39.21 | 37.99 | 28.22 |
| FY2006 | 55.72 | 47.51 | 32.47 |
| FY2007 | 62.46 | 42.85 | 30.25 |
| FY2008 | 79.25 | 45.56 | 31.80 |
| FY2009 | 83.57 | 44.72 | 32.87 |
| FY2010 | 69.76 | 47.93 | 38.10 |
| FY2011 | 85.09 | 58.37 | 41.12 |
| FY2012 | 111.89 | 73.18 | 41.29 |
| FY2013 | 107.97 | 70.74 | 48.67 |
| FY2014 | 105.52 | 73.16 | 55.48 |
| FY2015 | 84.16 | 60.49 | 49.71 |
| Nov-15 | 41.61 | 60.70 | 45.93 |
Deregulation in this sector is interesting phenomenon & shows how government seeks to resolve a problem. Till few years back, OMCs were given bonds for the under-recoveries. Even SBI was not willing to discount these bonds. Situation came to a point where OMCs had no money to even buy crude. Left with no option, government deregulated Petrol. This time deregulation was put to practice too instead of just being on paper. Else OMCs could have gone bankrupt
The article states that the price paid by OMCs to refineries after deregulation of subsidy becomes 25.51 from 49.02 (similar figure for Petrol too). How this figure gets reduced is not explained. This article requires much more powerful demonstration to justify the subject
This is in fact correct Madhu. These stats come from the Government. Perhaps you are not factoring in that between the two periods, the price of crude oil has fallen over 50%. The difference is on account of that.
@MAdhu.. thats because of about 50% fall in crude oil prices leads to half the amount OMCs had to paid to refiners..
Hi Rajat, very helpful of you to publish industry / sector economics. They are indeed insightful. One question – post deregulation of petrol and diesel, has government fixed the margins which OMCs will earn from dealers.. i.e. price charged to dealers?
Yes. Adjust the chart above for the increase in prices and you will get to that.
I just stumbled upon your blogs by accident. I am quite amazed at the depth of your analysis of the oil marketing companies. With deregulation of the petroleum products, the outlook for this sector has undergone a dramatic change for the better. I feel if the economy improves further, this sector will see a scramble for market share. This will ultimately benefit the consumers and stock market. I wish you could look into your crystal ball and give indication of likely winners with 3 years perspective. I have a liking for BPCL with its hands in marketing, refining and downstream pies. But, I am not sure. Kindly guide investors like me.
Thank you and regards.
“OMCs earn most of their revenue from marketing”
What exactly does this mean? Please elaborate!
Exactly that – Oil Marketing Companies market Oil. How else do I do this 🙂
Yes it’s helpful information. 👍👍
Is Oil India Limited an oil marketing company??
yes
sir It was really an insightful blog for me.i am student of school of petroleum management from gandhinagar. can you please help me with all the marketing policy that is currently being imposed, and how pricing is done?(in depth),can you supply me any document related to this .