What is Volatility?
Volatility in the context of stock markets is the amount of price change which a stock experiences over a given period of time (i.e. breadth or the difference between high-low). Put differently, if the price stays relatively stable, the stock has low volatility.
A highly volatile stock is one which moves randomly in the absence of any major news-flow and experiences rapid increases and dramatic falls. That said, stock price volatility is often also caused by the random arrival of new information relating to a particular stock. In the post below, I will talk about stocks which are generally volatile and not about the ones which are volatile on a given day because of unexpected events, good or bad news, earnings/ economic reports, political news, world events, etc.
Volatility: An Overall Opportunity
Volatility is an investor’s best friend. Periodic volatility in the stock market is healthy and good for the market. It provides an opportunity to investors to accumulate high quality shares at low price for the long term. It gives investors an opportunity to take advantage of price swings to buy when prices fall below the value of the company and sell when they rise well above the company’s intrinsic value.
In reality however traders use volatility to make quick gains on swing trades without necessarily having a long term view of accumulating the stock.
How to look for Volatile Stocks?
This is a very open ended question. Different market participants will have different definition for what constitutes a volatile stock. Primarily however everyone should/will be concerned about one or more of the following:
| A big difference in the HIGH and LOW price of the stock for the day. | Look for “Most Volatile Stocks for Swing Trading” Discussion below |
| Stocks which advance or decline the most in a single trading session (almost every finance based website on the web will have this list). | |
| Most active stocks based on volume. | Look for “Value vs. Volume” Discussion below. |
| Most active stocks based on value. |
To get a list of stocks on any of the above basis, make sure you choose the official stock exchange (BSE, NSE) website. Here are the links:
- NSE India Live Market Report Section
- BSE India Live Market Report Section
Most Volatile Stocks for Swing Trading
If you are a swing trader, you should be looking for 2 things – (i) volume & (ii) Price. It’s pointless to look for stocks which move in a range of 30-50% but are so thinly traded that you cannot trade more than a few thousand rupees in them. At the same time looking only at the ‘A List stocks’ (i.e. stocks belonging to the BSE 200) will give you a list of stocks with enormously high trading volumes but very little price movement. To take an example, the table below shows BSE 200’s most active stocks (arranged volume wise) for 9th March 2015:
| Company | High | Low | Difference | Change | Volume |
| Suzlon Energy | 27.65 | 26.2 | 1.45 | 5.53 % | 17402682 |
| Unitech | 19.65 | 18.55 | 1.10 | 5.93 % | 8895454 |
| Pipavav Defence | 65.85 | 60.8 | 5.05 | 8.31 % | 6979229 |
| HCL TECH | 2074.8 | 1975 | 99.80 | 5.05 % | 6140792 |
| Jaiprakash Associates | 28.6 | 27.1 | 1.50 | 5.54 % | 4216337 |
| Alok Industries | 10.04 | 9.21 | 0.83 | 9.01 % | 4120381 |
| Adani Power | 58.4 | 54.65 | 3.75 | 6.86 % | 2762786 |
| Power Grid | 158.05 | 154.75 | 3.30 | 2.13 % | 2548792 |
| Sun Pharma Advanced Research | 565 | 475 | 90.00 | 18.95 % | 2500993 |
| Reliance Power | 60.8 | 58 | 2.80 | 4.83 % | 2483163 |
| GMR Infrastructure | 17.75 | 17.2 | 0.55 | 3.20 % | 2429351 |
| Reliance Communication | 67 | 62.45 | 4.55 | 7.29 % | 2054590 |
| Ashok Leyland | 74.05 | 72.2 | 1.85 | 2.56 % | 1809011 |
| Jindal Steel | 200.9 | 191.7 | 9.20 | 4.80 % | 1786479 |
| Axis Bank | 605.25 | 590 | 15.25 | 2.58 % | 1784158 |
| State Bank | 294 | 288.9 | 5.10 | 1.77 % | 1636250 |
| Jaiprakash Power | 12.15 | 11.4 | 0.75 | 6.58 % | 1630068 |
| Housing Dev | 113.3 | 110.45 | 2.85 | 2.58 % | 1594651 |
| Bf Utilities | 806.9 | 666 | 140.9 | 21.16 % | 1538095 |
| Hindalco | 150 | 140.1 | 9.9 | 7.07 % | 1455352 |
While the volumes are really high the % change and the daily high low is not very wide apart. So while these stocks may make sense for algorithmic traders, if you are in pure swing trading, you may want to look for stocks outside of the ‘A List’. Your intention will naturally be to find stocks which have great breadth in the high/ low prices while at the same time maintaining sufficiently high trading volumes.
But keep also in mind that empirical/ historical evidence suggests that low priced stocks (i.e. below Rs. 100 a share, as you see in the list above) with very high trading volume, will over time deteriorate, i.e. result in losses. So choose them only for short duration trades as they are hardly ever investment grade. I bet 3 years from now, most stocks in the list above will be trading far lower, irrespective of where the market heads.
The correlation between price and volatility will depend upon 2 things – (i) How much money would you like to trade and (ii) how long would you want to hold the stock. If you want to trade Rs. 1000 – even a thinly traded stock will work for you.
“The table below is based on stocks which in addition to being volatile on an intra-day basis have sufficient trading volumes for you to safely trade Rs. 10,000 – Rs. 50,00,000 (Rs. 10 thousand – Rs. 50 lacs) on intra-day basis.”
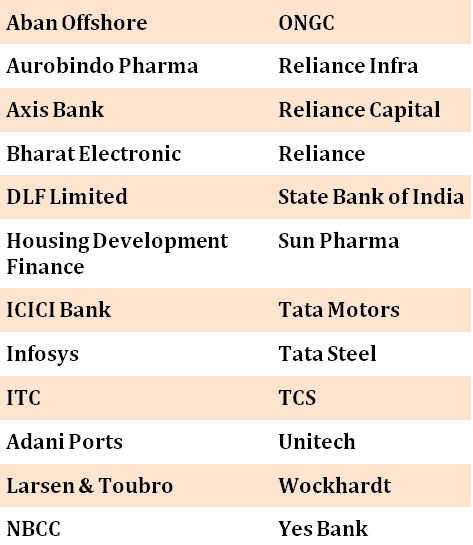
Methodology:
- Stocks are selected from the top 500 volume generators out of the ~ 3200 stocks trading on the BSE.
- A 30 day average sample (for each of the months from November 2014 – March 2015) was taken for high-low price breadth.
- The stocks in the table below were common on most of the 30 day sample.
Value vs. Volume
While the above discussion and stock selection was based on the volume of stocks traded, keep in mind that for many traders, value may be better criteria.
Look at the table below – while some companies will be common in both the tables, there will be many differences. A stock like Larsen & Toubro which trades @ Rs. 1750 (price on 9th March 2015) may not generate high trading volume based on the number of shares traded but generates high trading value making it a great pick for swing traders. The important metric to think about is the money which a trader will be trading with (value) more than the number of shares (volume) which can be bought using that amount of money.
| Volume vs. Value comparison for 9th March 2015 | |||
| Company | Volume | Company | Value (In Rs.) |
| Suzlon Energy | 17402682 | HCL TECH | 12195360530 |
| Unitech | 8895454 | Sun Pharma Advanced Research | 1347568603 |
| Pipavav Defence | 6979229 | BF Utilities | 1154384044 |
| HCL TECH | 6140792 | Maruti Suzuki | 983184512 |
| Jaiprakash Associates | 4216337 | Titagarh Wagon | 789044445 |
| Alok Industries | 4120381 | Axis Bank | 586028441 |
| Adani Power | 2762786 | HDFC Bank | 559873178 |
| Power Grid | 2548792 | State Bank | 476432623 |
| Sun Pharma Advanced Research | 2500993 | Suzlon Energy | 468983949 |
| Reliance Power | 2483163 | Pipavav Defence | 443688086 |
| GMR Infrastructure | 2429351 | Larsen & Toubro | 403179321 |
| Reliance Communication | 2054590 | Indus Ind Bank | 401827657 |
| Ashok Leyland | 1809011 | Power Grid | 399114211 |
| Jindal Steel | 1786479 | ITC Ltd. | 385264506 |
| Axis Bank | 1784158 | Tata Elxsi | 361600256 |
| State Bank | 1636250 | Jindal Steel | 351623241 |
| Jaiprakash Power | 1630068 | Bombay Burmah Trading | 341037141 |
| Housing Dev | 1594651 | ICICI Bank | 323138377 |
| BF Utilities | 1538095 | Sun Pharma | 321998436 |
| Hindalco | 1455352 | MCX Ltd | 317442223 |
A Word on Volatility Index
Both on the NSE & BSE, you will find a volatility index and may be wonder what purpose does that serve?
The volatility index value is the percentage by which investors expect the markets to move in the next 30 days. So, if the value is at 30, investors are expecting the markets to change by 30%.
In 2008, NSE launched volatility index on NIFTY 50 – India VIX – measures market’s implied volatility derived from option prices over the near term.
In 2010, BSE launched volatility index on Sensex – Sensex Realized Volatility (REALVOL) index- aims to provide market participants with an accurate measure of the historic volatility of the 30-stock index over 1, 2 and 3-months time horizons.
Explained simple, both these volatility indices aim to measure the overall market’s expectation of volatility (fluctuation in price) both upside and downside over the near term.
The index has an inverse relationship with the market. So when the volatility index level is low, it implies that investors are optimistic about the market (i.e. most investors are betting that the market will rise in future).
On the contrary, a high volatility index level suggests that investors expect the market to move sharply in either direction.
I could talk about how volatility is calculated but that will be an even longer and somewhat pointless explanation. More simply – it is calculated by averaging out the order book of Nifty options on the basis of the best bid/ask quote of the near and next month Nifty option contracts.
Another great writeup as usual Rajat. Thanks
An article request from me, when you have some time:
It would be great if you could write something about how a stock price is determined. I mean, why would a stock like Bosch trade at 26000+ while Noida Toll Bridge would trade at 35? Does it purely depend on how many shares are ‘in circulation’? Also, we hear a lot about market operators – how exactly do they manipulate stocks. Consider your example of Suzlon.. It has seen a volume of ~18 million, with just a difference of 1.45. What does it mean? Is it being ‘handled’?
Thanks!
Thanks Vijay.
Good suggestions points taken. I will write that soon.
Great post, thanks for sharing. I am new in trading and always searching for reading articles and news about trading. And I am also following some online articles and blogs like Traders Exclusive but this post impressed me a lot for its unique tips about volatile stocks. Thanks again.
Thanks Joel. Glad you like it.
Hi,
Really informative.
If I do intraday by fixing Stop Loss and Target on both long and short as % of Average Price Range, is 30 days price volatality index somewhat reliable?
Thank you,
RM
The governing word here is – ‘Somewhat’.
It is reliable but to be sure – before you shortlist one or more stocks check if the volatility was due to some news around the stock during that month? Also, you may wanna look at the trading volume of the stock for a period before that month. If it was unusually high for that month, then it may not be sustainable.
Please suggest few best stocks for swing trading but should be in the range of 500 t0 1100 price max
thanks a lot… i have always wanted to have some information on swing…. logical…. now i have got it… god bless
Dear sir,
I am new to the market and found your article very interesting, but i had some doubt as you said volatile stocks move in relation to the current market trend but as on 30-mar-2016 HDFC Bank which is trading nearly at the price of 1020 was nearly traded with a huge volume but the difference between the high and low was very low(app. 10rs).
can you please clarify regarding the same..
Thanks
Very informative and interesting information – Subrahmanyam C
I’m beginner in the field of stock Trading and Investment.
Suggest me low price, less volatile and reasonable growth shares.
Dear Rajat Sharma, your article is really good, Can you please list some medium volatile shares for the intraday trading.
I think your recommendations are near to to reality and get benefits in stocks trading it’s not vertual but getting real market scenario and becoming useful
It’s practically and real so we can go through market trend and get benefit
THANK U,JUST KEEP ON GOING.BUT SIR I GOT IT AFTER A HUGE LOSS IN INTRADAY.
Respected sir,
I want your guidance on how to select a stock in NSE , NIFTY, BSE sensex for trading.
Which are most volatile stocks in A group – which can be chosen for trading& if price does not move as per expectations, we can take delivery for long term .
Thanks,
Please subscribe and write in to me at rajat@sanasecurities.com