As an investor you may face the dilemma of selecting 1 out of 2 or 3 (or even more) stocks. This typically happens when an investor already has a diversified stock portfolio and does not want to add more than 1 new stock. While it may be tempting to add equal quantity of all 3 stocks, although over diversification reduces risk, also diminishes the potential reward. This is where the investor must select the best stock to buy out of a list of potentially rewarding stocks – a further filtering down to avoid over diversification.
The job is easy when you have to select from amongst stocks operating in the same industry / sector. In my previous posts I have explained how to do that. To make it more interesting in this write-up I will do the following:
- Instead of taking stocks from the same industry take 3 stocks operating in different industries.
- 2 of these stocks have been making losses and hence it is not possible to come with their price / earnings ratio.
- I will assume that I have to select 1 out of these 3 stocks to include in my portfolio as a multibagger stock pick i.e. a high risk high reward pick:
| Company | Industry / Sector |
| Anant Raj Limited | Construction |
| Unity Infraprojects | Construction and contracting |
| McNally Bharat Engineering | Engineering (turnkey services) |
The key to long term equity analysis is research on both qualitative and quantitative aspects. You should break down the companies on the basis of management quality, business plans, future markets as also on the basis of their financial metrics. There is no science when it comes to factors which are more important than others. In general I always give higher importance to management quality, future potential and future plans of the company, i.e. Qualitative aspect.
Quantitative Aspects – Valuation (see more ratio analysis in foot notes)
When it comes to valuation, there are 2 equally popular methods which analysts use to determine if the stock is under/over-valued – the Price Earnings (PE) method and the cash flow or the discounting of cash flow method.
The price earnings method is the easier of the two and is readily applicable to any company unlike the cash flow method which is harder to apply to companies operating with high levels of debt and where revenue stream will start at a future stage.
Fair Value Based on Price Earnings (P/E) – The most helpful method to check if a stock is fairly valued is by comparing its current PE with its historic average.It is easy to calculate the price earnings ratio of any stock by simply dividing its current price with its reported EPS of the last 4 quarters (take consolidated EPS). In the tables below I have calculated the 10 year average PE for all three companies.
| Anant Raj | Average P/E = 17.48 | ||||
| 2005 | 2006 | 2007 | 2008 | 2009 | |
| Price | 3.16 | 138.70 | 220.69 | 228.60 | 40.20 |
| EPS | 0.15 | 12.89 | 5.25 | 14.81 | 7.03 |
| P/E | 21.07 | 10.76 | 42.04 | 15.44 | 5.72 |
| 2010 | 2011 | 2012 | 2013 | 2014 | |
| Price | 132.70 | 83.30 | 58.50 | 63.05 | 57.00 |
| EPS | 8.07 | 5.69 | 3.84 | 3.65 | 3.51 |
| P/E | 16.44 | 14.64 | 15.23 | 17.27 | 16.24 |
| McNally Bharat | Average P/E = 17.98 | ||||
| 2005 | 2006 | 2007 | 2008 | 2009 | |
| Price | 57.10 | 139.70 | 135.05 | 172.00 | 38.85 |
| EPS | 1.66 | 2.02 | 6.28 | 7.83 | 15.76 |
| P/E | 34.40 | 69.16 | 21.50 | 21.97 | 2.47 |
| 2010 | 2011 | 2012 | 2013 | 2014 | |
| Price | 293.50 | 218.50 | 87.15 | 68.40 | 68.30 |
| EPS | 18.22 | 21.64 | 21.31 | (7.06) | (24.51) |
| P/E | 16.11 | 10.10 | 4.09 | – | – |
| Unity Infraprojects | Average P/E = 5.64 | ||||
| 2005 | 2006 | 2007 | 2008 | 2009 | |
| Price | 94.34 | 94.34 | 87.99 | 106.71 | 15.46 |
| EPS | 12.13 | 23.17 | 31.67 | 44.93 | 52.61 |
| P/E | 7.78 | 4.07 | 2.78 | 2.38 | 0.29 |
| 2010 | 2011 | 2012 | 2013 | 2014 | |
| Price | 120.20 | 63.60 | 48.60 | 26.65 | 22.50 |
| EPS | 57.79 | 12.96 | 14.37 | 13.98 | 0.84 |
| P/E | 2.08 | 4.91 | 3.38 | 1.91 | 26.79 |
At the current price of Rs. 38 (as on 30 March 2015), Anant Raj’s trailing 12 month PE comes to 7.6 which is at a 56.5% discount to its 10 year average PE Multiple (i.e. the fair value of this stock should be Rs. 87.7 and you are getting it at Rs. 38).
To explain further – I took the last 4 quarters EPS (you can get that on this page – look for valuation analysis – quarterly). I divided the current price of Rs. 38 with this EPS to arrive at the current PE of 7.6. This is at a discount to the 10 year PE. Fair value of the stock @87.7 is arrived at by multiplying the 10 year PE of 17.48 with the EPS of the last 4 quarters which is 5.02.
How do you calculate Price to Earnings (PE Ratio) when EPS is negative?
PE method cannot be applied to companies which report losses in previous years. This is because negative earnings as the denominator of PE will yield negative result.
One way of overcoming this problem is to take estimated future earnings for a year in which you believe the earnings will turn positive. The current market price of the share can then be divided by its expected EPS at a future date. This is called the Forward PE Multiple. This naturally will involve some bit of estimation.
Another way of doing this ‘when you are comparing 2 or more companies’ on the basis of PE multiple is by using the reciprocal of PE – the EPS/Price ratio. To explain this in our example:
Mc Nally Bharat’s trailing 12 month EPS comes to (20.09),and its current price is Rs. 81 (as on 30 March 2015). Its EPS/Price = (0.25)
Unity Infra’s trailing 12 month EPS comes to (16.77),and its current price is Rs. 16.85 (as on 30 March 2015). Its EPS/Price = (0.99)
For the sake of comparison, the EPS/Price ratio of Anant Raj = 5.02/38 = 0.13
Now just rank the 3 companies on the basis of EPS/ Price ratio. 0.13 – (0.25) – (0.99). What we just did was rank the companies on the basis of earnings performance – best to worst.
To understand the calculation better for companies with positive EPS, I recommend that you see this post – on how to calculate the fair value of a stock based on the price earnings method.
Qualitative Aspects
Of course past performance is never a guarantee of future results. Since the above quantitative analysis is based on past numbers it will not tell you much about the future. In future the numbers will change based on how well or badly these companies perform. This is why it is important to look at factors which are likely to increase and decrease future earnings.
I will not get into much detail on these aspects but based on a cursory look at the annual report and publicly available material on these companies, one could conclude the following:
Anant Raj Limited is involved in building an array of Special Economic Zones (SEZs), IT Parks, Hotels, Commercial Complexes, Malls, Residential / Service Apartment and other infrastructure projects.
Anant Raj’s profitability and efficiency has suffered mainly because of the company’s geographical concentration in the real estate market of the Delhi NCR region which has been the worst performing realty market in the country over the past 2-3 years. I am convinced that the real estate market in the NCR region is not going to improve for a very long time. This is mainly because of oversupply of units coupled with increasing circle rates making it unattractive to deploy unaccounted money in real estate which was primarily the cause for high real estate prices in the region. At the same time the company owns high quality land bank in the NCR region acquired at low cost.
Unity Infra Projects Limited is engaged in construction and engineering activities primarily in India, Nepal and Bangladesh. The Company operates in three segments: (i) Civil construction, (ii) Irrigation and water supply and (iii) Transportation engineering.
- Diversified Revenue stream with pan India presence
- Healthy order book –Unity Infra projects currently has 70 ongoing projects. Of these more than 65% i.e. 46 projects are in the building space and the balance – 12 are in water/irrigation and 10 contracts are in the transport segment. Company’s current order book stood at Rs. 3,456 Cr (as of December 2014). Its order book-to-sales ratio stood at 2.2x FY14 revenues. The Company recently also bagged a landmark project for the development of Metro line III – Colaba–Bandra-SEEPZ line in Mumbai.
- Extremely high levels of Debt – While the Company’s strong order inflow could serve as key trigger for the stock in the near term due to so many ongoing projects the Company has experienced a declining trend in its net profit mainly on account of high finance cost and delays in project execution.
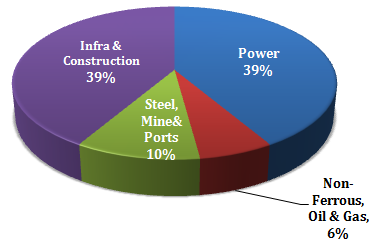
McNally Bharat Engineering provides turnkey solutions in the power, steel, aluminium, material handling, mineral beneficiation, port cranes, cement, oil & gas, civic and industrial water supply etc.
- Reputed Public Sector client base – The Company’s major portion (about 80%) of order book comes from reputed public sector entities & balance from established private sector companies.
 Order Book Concerns – Order book as on September 30, 2014 stood at Rs. 6,290 Cr. However, out of the total order book, the Company has identified slow moving orders (mostly pertaining to power sector) aggregating Rs. 670 Cr. It looks unlikely that the company will be able to recover this money any time soon. This has resulted in high working capital requirements for the company.
Final Analysis
If I had to decide upon the best stock to buy out of these 3 with a time frame of 3-5 years, my choice would be between McNally Bharat and Unity Infra.
McNally is experiencing a declining trend in net profit mainly due to working capital shortage for the past few years which has resulted in slower execution of projects and credit crunch. The inability to recover money from clients has resulted in cash depletion. The gap is being funded by fresh short-term borrowings by the company which has resulted in higher finance cost. At the same time during the year, the company was able to book fresh order of Rs. 3,980 Cr. Execution of these projects will further increase the finance cost of the company.
Unity Infra while burdened with debt has the strongest order book. If the company is able to execute and deliver these products as per schedule, the stock will outperform its peers over a 5 year period.
{Footnote}
Ratio Analysis
It is important to benchmark the performance of a business either with its historic performance or with the performance of another company within the same industry/ sector. Ideally one should follow the rule of – ‘First Amongst Equals’ – i.e. compare the performance of a stock from one industry with other stocks operating in the same industry. This is because different industries have varying operating metrics, read more on this aspect in our post on financial statement analysis. In case of interest, here are the various operating metrics of each of the above company.
Profitability
| Operating Profit (%) | 2010 | 2011 | 2012 | 2013 | 2014 | 5 Year Average |
| Anant Raj | 90.28 | 55.54 | 39.80 | 28.73 | 29.21 | 48.71 |
| Unity Infraproject | 12.96 | 13.70 | 13.70 | 13.68 | 12.05 | 13.22 |
| McNally Bharat | 5.82 | 5.70 | 6.72 | 7.46 | 7.75 | 6.69 |
| Net Profit (%) | 2010 | 2011 | 2012 | 2013 | 2014 | 5 Year Average |
| Anant Raj | 83.21 | 39.58 | 26.36 | 18.75 | 21.53 | 37.89 |
| Unity Infraproject | 5.64 | 5.42 | 5.42 | 3.88 | 0.17 | 4.11 |
| McNally Bharat | 2.34 | 2.72 | 3.16 | 1.77 | (3.38) | 1.32 |
Efficiency
| ROCE (%) | 2010 | 2011 | 2012 | 2013 | 2014 | 5 Year Average |
| Anant Raj | 7.20 | 5.25 | 3.63 | 3.31 | 2.86 | 4.45 |
| Unity Infraproject | 15.78 | 27.20 | 33.27 | 30.92 | 18.72 | 25.18 |
| McNally Bharat | 13.00 | 17.93 | 24.26 | 23.78 | 32.54 | 22.30 |
| ROE (%) | 2010 | 2011 | 2012 | 2013 | 2014 | 5 Year Average |
| Anant Raj | 0.68 | 0.46 | 0.30 | 0.28 | 2.51 | 0.85 |
| Unity Infraproject | 15.19 | 10.68 | 11.46 | 10.98 | 0.47 | 9.76 |
| McNally Bharat | 13.20 | 14.88 | 18.08 | 9.92 | (22.86) | 6.64 |
Click these links for explanation on calculation of profitability analysis and efficiency analysis.
Hi Rajat, I have just come across your site and I must say it has a wealth of information. I myself do a modicum of Fundamental Analysis of a stock before investing in it and I largely follow the value principles of investing. I have two questions of you:
1. Where do you readily get the EPS for the last 4 quarters of a company? and
2. How do you calculate the PEG ratio for a company.. to estimate its future PE? And what is its(PEG Ratios) reliability to make an investment decision?
Would love to hear your views on this.
Regards
Vijay
Thanks Vijay.
1. You can get the EPS for companies on BSE’s website, you can always check on our website with some analysis to go with it. We keep our reports updated at all times. See link – http://www.sanasecurities.com/bse-200-companies
2. PEG Ratio is used to determine a stock’s value while taking into account earnings growth. You can calculate it by dividing the PE by its Expected Growth Rate in Earnings.
A high PEG ratio indicates that the investors are expecting the earnings (and accordingly the price of the company’s shares) to grow at a faster rate and vice versa. By dividing the P/E ratio by the EPS growth rate, the resulting ratio is better for comparing companies with different growth rates.
Peter Lynch argued in his 1989 book One Up on Wall Street that “The P/E ratio of any company that’s fairly priced will equal its (EPS) growth rate”. This means that a fairly-valued company should have its PEG equal to 1. So, a PEG ratio greater than 1 means the stock is relatively expensive, whereas PEG ratios lower than 1 means a stock is below its “fair value.”
Thank you so much . Wonderful Explanation . I had this doubt since long because mos of the times, a sector as a whole react together to market conditions making it difficult to decide which stocks to buy . They become expensive or cheap as a whole
Happy that its clear now. Thanks for your question the other day.
Very informative note.
I want to understand and further study for Avg P/E. The year is already mentioned for EPS, but for which date the price is taken into consideration.
Also would you assist in letting us know, from where can I take the actual date price. I tell you, I look into the charts/ candle to know the price on desired date. Is it correct way?
Is EPS to be considered precisely be- Diluted or Basic?
With this example, how would you calculate the EPS of Mcleod Russel of the last 4 quarters where it is negative twice. Would this be 7.11?
PS: efficiency analysis link is not working.
Regards,Puru
Prices were taken as of 31st March every year. You can actually take any price during the year but just be consistent. If on a given day (say 31sr March) prices were unusually high or low just for that one day – it balances out with a 10 year average. Also in case the prices are really high/ low because of some one of event – you may want to discount that appropriately.
For prices use BSE/ NSE or even moneycontrol / yahoo finance.
EPS = Always take diluted. EPS – Yes sum it up , no harm in doing that.
Efficiency link was broken, it works now. Thanks.
P/E has been considered for 10 years.
But EPs only for last 4 quarters.
That is correct sir!