Over the last few years, the market capitalization gap between Infosys and TCS has widened. TCS’ market cap is now almost 2.62 times more than its nearest Indian competitor, Infosys.
- TCS Market Cap – Rs. 853,855.14 Cr. (On 24th June 2019)
- Infosys Market Cap – Rs. 325,167.23 Cr. (On 24th June 2019)
In March 2009, TCS was 1.42 times smaller than Infosys in terms of market value. TCS’ valuation is now more than the market value of Infosys, Wipro, HCL Tech & Tech Mahindra, combined.
| Company Name | Price (Rs.) | Market Cap. (Rs. Cr.) |
| TCS | 2,275.50 | 853,855.14 |
| Infosys | 745.5 | 325,167.23 |
| Wipro | 283.9 | 171,343.86 |
| HCL Tech | 1,077.90 | 146,193.30 |
| Tech Mahindra | 728.25 | 71,691.56 |
Price as on 24th June 2019.
TCS is now trading at a premium to Infosys due to better revenue growth and margin profile (TCS currently trades at a 22% premium to Infosys). The revenue gap between both the companies, which stood at around Rs. 31,676.36 Cr. in FY15, has now become Rs. 63,788.00 Cr. at the end of FY19.
A combination of management issues at the top, impacting revenue growth, inferior operational efficiency and pricing pressure has led to the steady reduction in Infosys’ margins over the period of time.
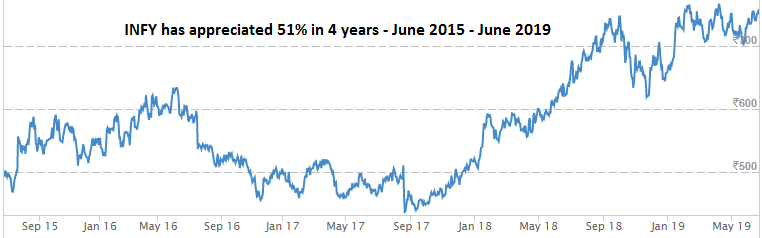
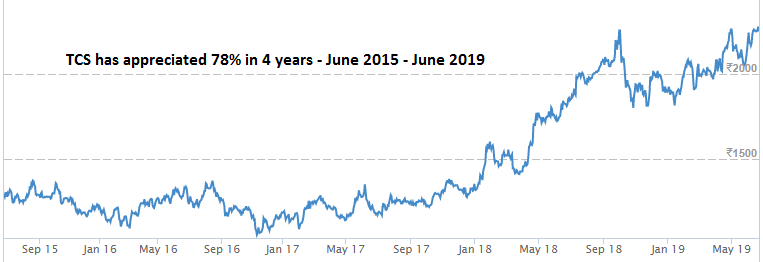
Infosys and TCS Share Price Performance
Infosys and TCS – Comparison
| Infosys | TCS |
 |
 |
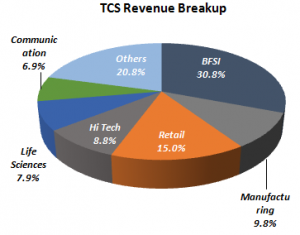
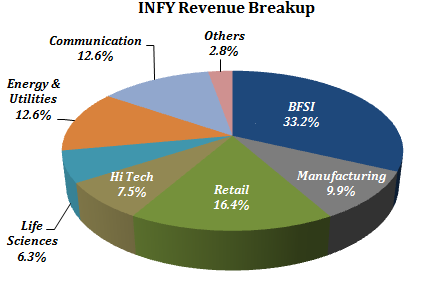
| Geographical Breakup – 61.2% of the overall revenue of the Company comes from the U.S., followed by 24% from Europe, 2.3% from India, and 12.5% from the Rest of the World. | Geographical Breakup – 53% of the overall revenue of the Company comes from the U.S., followed by 27.7% from Europe, 6.4% from India, and 12.2% from the Rest of the World. |
Infosys and TCS Financial Performance
| Particulars | FY15 | FY16 | FY17 | FY18 | FY19 |
| INFY Revenue (In Rs. Cr.) | 53,319.00 | 62,441.00 | 68,484.00 | 70,522.00 | 82,675.00 |
| Growth | – | 17.11% | 9.68% | 2.98% | 17.23% |
| TCS Revenue (In Rs. Cr.) | 94,648.41 | 108,646.00 | 117,966.00 | 123,104.00 | 146,463.00 |
| Growth | – | 14.79% | 8.58% | 4.36% | 18.98% |
| INFY EBIT (In Rs. Cr.) | 13,854.00 | 15,620.00 | 16,901.00 | 17,148.00 | 18,159.00 |
| EBIT Margin | 25.98% | 25.02% | 24.68% | 24.32% | 21.96% |
| TCS EBIT (In Rs. Cr.) | 22,683.02 | 28,789.00 | 30,324.00 | 30,502.00 | 37,450.00 |
| EBIT Margin | 23.97% | 26.50% | 25.71% | 24.78% | 25.57% |
| INFY PAT (In Rs. Cr.) | 12,372.00 | 13,489.00 | 14,353.00 | 16,029.00 | 15,404.00 |
| PAT Margin | 23.20% | 21.60% | 20.96% | 22.73% | 18.63% |
| TCS PAT (In Rs. Cr.) | 19,852.18 | 24,270.00 | 26,289.00 | 25,826.00 | 31,472.00 |
| PAT Margin | 20.97% | 22.34% | 22.29% | 20.98% | 21.49% |
| INFY EPS (In Rs.) | 28.42 | 30.98 | 32.97 | 35.50 | 35.38 |
| EPS Growth Rate | – | 9% | 6% | 8% | -0.3% |
| TCS EPS (In Rs.) | 52.91 | 64.68 | 70.06 | 68.83 | 83.87 |
| EPS Growth Rate | – | 22% | 8% | -2% | 21.9% |
| Return Ratios | |||||
| INFY ROCE | 27.31% | 25.30% | 24.50% | 26.41% | 27.93% |
| TCS ROCE | 43.57% | 40.20% | 34.91% | 35.56% | 41.64% |
| INFY ROE | 34.07% | 30.36% | 28.97% | 31.33% | 32.40% |
| INFY ROE | 39.21% | 34.15% | 30.49% | 30.34% | 35.19% |