Karnataka Bank Limited (“Karnataka Bank” or the “Bank”) is one of India’s largest growing private sector banks with an expanding presence across the country. The Bank currently services through a network of 2,374 service outlets with 829 branches, 1 Extension Counter and 1,544 ATMs (incl. 280 recyclers) in 551 centres across India.
Price – Rs. 113.80

The Bank has reported credit growth of 17% YoY and 4% sequentially to Rs 51,961 Cr. Retail advances to corporate advances ratio stood at 44:56. Its priority sector advances ratio stood at 47.44% (figures as on Q3 FY 2019).
Last 5 Quarters’ Advances (Rs. Cr.)
| Dec 2017 | March 2018 | June 2018 | Sept 2018 | Dec 2018 |
| 44,354 | 47,252 | 47,731 | 49,970 | 51,961 |
Financial Position
| Particulars | FY14 | FY15 | FY16 | FY17 | FY18 |
| Net Interest Income
(In Rs. Cr.) |
1,056.07 | 1,168.85 | 1,302.87 | 1,490.62 | 1,857.65 |
| Growth | – | 10.7% | 11.5% | 14.4% | 24.6% |
| Non Interest Income
(In Rs. Cr.) |
505.58 | 507.00 | 542.86 | 809.34 | 954.34 |
| Growth | – | 0.3% | 7.1% | 49.1% | 17.9% |
| Total Net Income (In Rs. Cr.) | 1,561.65 | 1,675.85 | 1,845.73 | 2,299.96 | 2,811.99 |
| Operating Profit (In Rs. Cr.) | 687.05 | 773.38 | 854.53 | 995.80 | 1,473.16 |
| Net Profit (In Rs. Cr.) | 65% | 66% | 66% | 67% | 79% |
| EPS (In Rs.) | 311.03 | 451.45 | 415.29 | 452.26 | 325.61 |
| EPS Growth Rate | 29% | 39% | 32% | 30% | 18% |
| Historic P/E (Closing Price of 31st March) | 11.01 | 15.97 | 14.70 | 16.00 | 11.52 |
| CURRENT P/E (based on price of 20th February – Rs. 113.80 and EPS TTM – Rs. 15.10) | 7.54 | ||||
| Historic P/B (Closing Price of 31st March) | 0.59 | 0.56 | 0.43 | 0.77 | 0.60 |
| CURRENT P/B (based on price of 20th February – Rs. 113.80) | 0.59 | ||||
| Net Profit Margin Ratio | 29% | 39% | 32% | 30% | 18% |
| ROCE | 13.83% | 17.47% | 18.02% | 16.67% | 23.66% |
| ROE | 10.19% | 13.32% | 11.25% | 8.79% | 6.02% |
| Key Balance Sheet Figures | |||||
| Shareholder funds | 3,052.20 | 3,389.06 | 3,690.58 | 5,142.58 | 5,410.15 |
| Deposits | 40,582.83 | 46,008.61 | 50,488.21 | 56,733.11 | 62,871.29 |
| Growth | – | 13.4% | 9.7% | 12.4% | 10.8% |
| Borrowings | 1,915.19 | 1,037.76 | 1,051.48 | 832.62 | 815.97 |
| Advances | 28,345.49 | 31,679.99 | 33,902.45 | 37,003.65 | 47,251.75 |
| Growth | – | 11.8% | 7.0% | 9.1% | 27.7% |
*Right Issue ratio of 1:2 on 24 October, 2016.
Quarterly Results
| Particulars | Q3 FY 2018 | Q2 FY 2019 | Q3 FY 2019 | Q-o-Q % | Y-o-Y % |
| Net Interest Income
(In Rs. Cr.) |
448.30 | 467.71 | 487.95 | 4.33% | 8.84% |
| Non Interest Income
(In Rs. Cr.) |
194.62 | 201.20 | 301.37 | 49.79% | 54.85% |
| Operating Profit
(In Rs. Cr.) |
321.90 | 356.33 | 400.37 | 12.36% | 24.38% |
| PAT (In Rs. Cr.) | 87.38 | 111.86 | 140.41 | 25.52% | 60.69% |
| EPS (In Rs.) | 3.09 | 3.96 | 4.97 | 25.51% | 60.84% |
Q3 FY 2019 Highlights:
- Karnataka Bank’s Q3 FY19 net profit increased by 60.69% y-o-y driven by other income and operating income.
- Non Interest Income grew by 55% to Rs. 301.37 Cr.
- GNPA ratio stood at 4.45% vs. 4.66 % in previous quarter.
- Net NPA was unchanged at 3% on sequential basis.
- Karnataka bank’s IL&FS exposure stood at Rs. 155 Cr.
- IL&FS Energy – Rs. 50 Cr.
- IL&FS Transportation Network – Rs. 30 Cr.
- IL&FS parent – Rs. 75 Cr.
Peer Comparison
| Name | Last Price | Market Cap. | NPA | P/E | P/B |
| HDFC Bank | 2,108.35 | 573,572.27 | 0.42% | 30.10 | 5.21 |
| Kotak Mahindra | 1,289.75 | 246,088.69 | 0.67% | 36.53 | 4.87 |
| ICICI Bank | 345.20 | 222,414.87 | 2.58% | 64.28 | 1.96 |
| Axis Bank | 700.35 | 180,019.84 | 2.36% | 350.18 | 2.80 |
| IndusInd Bank | 1,480.80 | 89,235.74 | 0.59% | 22.91 | 3.80 |
| Bandhan Bank | 477.25 | 56,931.65 | 0.70% | 33.73 | 6.07 |
| Yes Bank | 217.85 | 50,385.56 | 1.18% | 11.24 | 1.96 |
| RBL Bank | 554.75 | 23,623.31 | 0.72% | 16.74 | 3.52 |
| IDFC First Bank | 44.75 | 21,397.31 | 0.95% | 14.92 | 1.16 |
| Federal Bank | 79.65 | 15,804.63 | 1.72% | 16.91 | 1.29 |
| City Union Bank | 176.90 | 12,970.88 | 1.74% | 20.33 | 3.64 |
| DCB Bank | 173.00 | 5,351.04 | 0.71% | 20.26 | 2.09 |
| Karur Vysya | 66.65 | 5,327.36 | 4.99% | 21.16 | 0.85 |
| South Ind Bk | 13.10 | 2,370.68 | 2.60% | 7.36 | 0.47 |
| Average | 47.62 | 2.84 | |||
| Karnataka Bank | 113.85 | 3,217.49 | 3% | 8.61 | 0.64 |
WHAT’S DRIVING THE STOCK?
Management – Professionally managed Bank
Robust Loan Growth
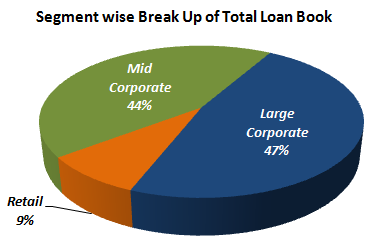
Over the years, Karnataka Bank has grown its credit almost entirely on the back of the corporate sector. In Q3 FY 2019, large corporates constituted 47% while SME/retail constituted 53%. Advances grew by 17.2% on YoY basis driven mainly by corporate credit. Retail credit grew by 9% y-o-y led by home loan growth (up 20% y-o-y). Management expects the slowdown in NBFCs a growth opportunity for the bank.
The Bank is currently undergoing a transformational exercise with Boston Consulting Group wherein the housing and MSME business structures are being completely redesigned. As a result of this, housing sanctions are up 55% yoy while MSME sanctions are up 21% yoy.
Focus on Improving CASA Ratio
Deposits growth stood at 12.8% YoY to Rs. 65,141 Cr. CASA ratio stood at 26.65% (lowest in last 5 quarters) vs. 27.08% Q-o-Q. The credit to deposit ratio was up at 79.8% as compared to 78.2% a quarter ago. The management expects its CASA ratio to grow to 29-30% over the next 2-3 years. Karnataka Bank added 13 branches in the quarter taking the total to 829.
Slippages in Control
Karnataka Bank in the last 2 years has reduced its stress pipeline consisting of restructuring dispensations, net security receipts and watch-list (special mention accounts – 2) from ~9.3% of loan book to 2.1% as of Q3FY19. The special mention accounts-2 category loans have declined to Rs. 333.6 Cr. in Q3 FY 2019 as compared to Rs. 346.7 Cr. in Q2 FY 2019.
While slippage ratio for the quarter was 0.86%, adjusting for IL&FS exposure, the slippage ratio would have been 0.53%. The Bank is taking concrete steps to improve slippage ratio further and provides strong asset quality guidance at 4% GNPAs and <3% NNPAs.
Attractive Valuation
On relative valuations, the stock is trading at discount to its peers. The stock is available at a P/B and P/E multiples of 0.59x and 7.54x, respectively.
GENERAL RISKS
Intense competition, Threat of New Entrants
Many of the services that were traditionally performed by the banks are now being performed by other players such as depositories, NBFCs and brokerage houses which have intensified competition in the banking industry.
Fintechs Disrupting Financial Service Market through innovative solutions across wide range of services such as payments, lending, data analytics, wealth management.
Thanks, very nice and informative analysis. But why trading at very low PE.