
L&T Finance Holding Limited (“L&T Finance” or the “Company”) is promoted by one of India’s leading construction companies- Larsen & Toubro (L&T). The Company offers a comprehensive portfolio of financial products and services through its wholly-owned subsidiaries. L&T Finance’s lending activities are divided into 2 segments – Retail (which accounts for ~53% of AUMs) and Infrastructure (which is ~47% of AUMs). The Company also offers investment management services including mutual funds and wealth management services.
Key Financial Indicators For L&T Finance
| Particulars | FY2018 | FY2019 | 9M FY2020 |
| Total Income (In Rs. Cr.) | 10,266 | 13,302 | 11,137 |
| Profit after tax (PAT) (In Rs. Cr.) | 1,278 | 2,232 | 1,789 |
| Net Worth (In Rs. Cr.) | 11,407 | 13,449 | 14,606 |
| Lending business Book (In Rs. Cr.) | 85,354 | 99,121 | 99,453 |
| Total assets (In Rs. Cr.) | 87,777 | 106,055 | 108,684 |
| Return on average total assets (PAT/ATA) | 1.59% | 2.30% | 2.22% |
| Consolidated gearing (times) | 6.60 | 6.80 | 6.37 |
WHAT’S DRIVING THE STOCK?
Well Diversified Loan Book
L&T Finance focuses on three lending verticals: rural finance (tractors, two-wheelers and micro loans), housing (real estate lending, loan against property and retail home loans) and infrastructure finance. These segments constituted about 28%, 27% and 40%, respectively, of the loan book as of Q3 FY20. The Company’s lending book has grown 5% y-o-y to Rs. 99,453 Cr. from Rs. 94,711 Cr. in December 2018. The biggest contributors to the growth were the home loan, two-wheeler, and real estate finance segments (above 31%, 23% and 15% growth respectively y-o-y in Q3 FY20).
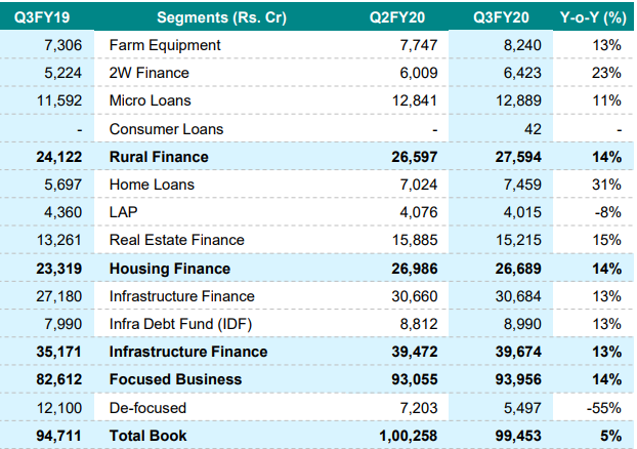
The Company’s portfolio has had a compound annual growth rate of 20% over the five Financial Years through March 31, 2019. The growth in the focused loan book has slowed down to 14% year-on-year as on December 31, 2019 and is expected to remain moderate in the near term.
Growth in Non-Lending Business
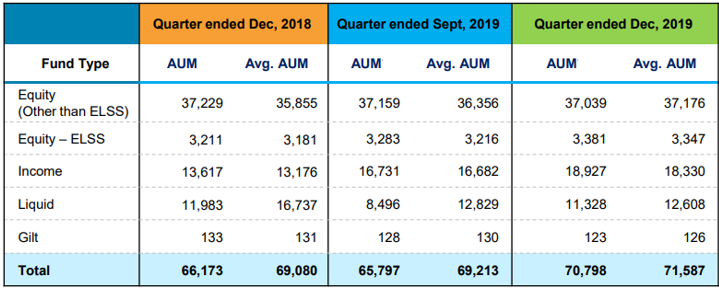
Under the non-lending businesses, the Company had sizeable average (quarterly) AUM of Rs 71,587 Cr. in the asset management business and closing assets under service of Rs 25,405 crore in the wealth management businesses as on December 31, 2019. In August 2019, the Company entered into an agreement to sell its entire stake in L&T Capital Markets Ltd (carrying out the wealth management business of the group) to IIFL Wealth Finance Ltd for a consideration amount of Rs 230 Cr. The transaction is subject to regulatory approvals.
Well Diversified Funding Profile
The funding profile of L&T Finance is diversified across capital markets and bank funding. The Company is a large and frequent issuer in capital markets and has strong banking relationships. Of the total borrowing of Rs 92,997 Cr. as on December 31, 2019, non-convertible debentures (NCDs; including retail), commercial paper, external commercial borrowings (ECB) and bank borrowings formed 43%, 9%, 3%, and 43%, respectively. The group has raised retail NCDs of Rs 2,408 Cr. and ECBs of around Rs 3,013 Cr. recently.
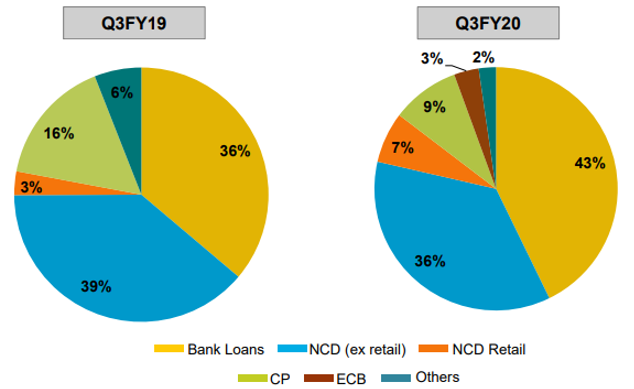
L&T Finance’ diversified resource profile is also reflected in the competitive average borrowing cost of 8.45% in FY 2019 (8.25% annualized for 9 M FY 2020), which is lower than most of its peers. L&T’s parentage (of L&T) also supports the Company’s resource profile.
Strong Parentage and Brand Equity of L&T
Larsen and Toubro (L&T) holds 63.86% stake in L&T Finance. L&T brand is a well respected and trustworthy brands in India which has helped the Company in attracting new customers and talent and in accessing capital.
The parent capital is a huge support to L&T Finance which has infused around Rs 3,779 Cr. to date. It has also provided an ongoing line of credit of Rs 2,000 Cr. to the Company, which could be used in times of contingency. Capital support from the parent, along with internal cash accrual, is expected to keep capitalisation adequate, with gearing (debt/net-worth) expected at around 7.0 times – not exceeding 7.5 times – on a steady-state basis.
Discount Valuation – At the current price of Rs. 57.45 (as on 15th May 2020), LT Finance’s trailing 12 months PE comes to ~ 6.18x which is at 67% DISCOUNT to its 5 years average PE Multiple of 18.48x. Based on this, fair value comes out to be Rs. 172.
| 5 year Average P/E = 18.48 | |||||
| FY15 | FY16 | FY17 | FY18 | FY19 | |
| Price | 62.80 | 63.85 | 123.65 | 157.10 | 153.60 |
| EPS | 4.26 | 4.27 | 5.20 | 6.26 | 11.10 |
| P/E | 14.73 | 14.94 | 23.79 | 25.10 | 13.83 |
| CMP | 57.45 | ||||
| EPS | 9.29 | ||||
| Current PE | 6.18 | ||||
RISK FACTORS
COVID 19 Impact
The nationwide lockdown declared by the Government of India to contain the spread of the Covid-19 will have near-term impact on disbursements and collections. This is likely to put pressure on collections and asset quality metrics of NBFCs. There could be some stress in the retail loan book, especially micro loans, as the livelihood and cash flows of the underlying borrowers have been impacted.
Moderate Asset Quality
On a consolidated basis, gross stage 3 and net stage 3 assets stood at 5.94% and 2.67%, respectively, as on December 31, 2019. This is primarily contributed by higher gross stage 3 assets in the infrastructure portfolio. However, given the challenges in the operating environment, the portfolio vulnerability has increased. In the wholesale segments, the concentration risk remains high.
Fair Analysis done.
Looking at the Average PE as shown above, the stock is undervalued.
But looking at the current economic circumstances , it would be fair to take value at PE at13.83 or say 14, rather than 18.48.
It is better to be safer & conservative under uncertain period.
The Estimate Value thus works to be Rs 130.06(EPS 9.29*14=130.06).
The stock is still undervalued & worth buying.
It would be more appreciable if you could have attached a technical chart & also Elliott wave count, if possible.
WhatsApp message @ 9350315768