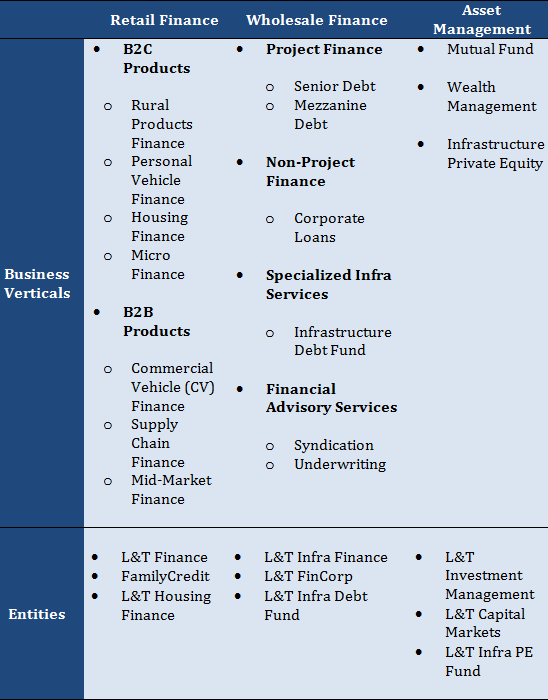
L&T Finance Holding Limited (“L&T Finance” or the “Company”) is promoted by one of India’s leading construction companies- Larsen & Toubro (L&T). L&T Finance is registered with the RBI as an Non Banking Financial Company (NBFC) and a Core Investment Company (CIC). The Company offers a comprehensive portfolio of financial products and services through its wholly-owned subsidiaries. The Company’s lending activities are divided into 2 segments – Retail (which accounts for ~53% of AUMs) and Infrastructure (which is ~47% of AUMs). The Company also offers investment management services including mutual funds and wealth management services.
*AUM – Assets under Management
This Stock Analysis report presents long term outlook and the future prospects of L&T Finance Holding Limited.
| Current Price (BSE) (08 July, 2015) | Rs. 71.05 |
| Market capitalization (08 July, 2015) | Rs. 12,027.69 Cr. |
| Face Value | Rs. 10 |
| EPS (TTM) | Rs. 4.29 |
| P/E | 15.80 times |
| No of Shares | 1720285900 |
| BSE 52 week High | Rs. 76.95 |
| BSE 52 week Low | Rs. 59.40 |
WHAT’S DRIVING THE STOCK
Well-Diversified Business
The Company provides diverse range of financial products and services across corporate, retail and infrastructure finance sectors, as well as mutual fund products, and wealth management services. Such diversified lending portfolio helps in keeping the Company insulated from sector specific slowdowns. For example, within retail business, L&T Finance has shifted focus from commercial vehicles and mid-market corporate segment due to downtrend faced by these segments over the last 2-3 years towards housing and personal finance. This is because a crash in property prices have made homes more affordable which has increased the demand for home finance.
Strong Financial Position
L&T Finance has shown consistent growth over the past three years i.e. between FY2012 – FY2015. Its net revenue from operations over this period grew at an impressive CAGR of 26.28%. For FY 2015, income from operations increased by 22.55% to Rs. 6,196.23 Cr. from Rs. 5,055.94 Cr. and Profit after Tax increased by 43.02 % to Rs. 850.72 Cr. from Rs. 594.84 Cr.
Financial Performance
| Particulars (in Rs. Cr.) | 2013 | 2014 | 2015 |
| Income from operations | 3,956 | 5,055 | 6,196 |
| Operating Profit | 3,118 | 3,797 | 4,553 |
| PAT | 730 | 596 | 854 |
| EPS | 4.25 | 3.03 | 4.2 |
| Equity Share Capital | 2,466 | 2,718 | 3,083 |
| Net Worth | 6,220 | 6,825 | 7,739 |
| Total Debt | 18,162 | 23,288 | 29,400 |
| Operating Profit Margin (In %) | 78.81 | 75.11 | 73.48 |
| Net Profit Margin (In %) | 18.43 | 11.77 | 13.73 |
| ROCE (In %) | 12.79 | 12.61 | 12.23 |
| ROE (In %) | 11.74 | 8.7 | 11.04 |
| Interest Coverage Ratio | 1.34 | 1.24 | 1.28 |
| Current Ratio | 1.06 | 1.00 | 1.01 |
At the current price of Rs. 70.05, the Company has a dividend yield of 1.17%. Macroeconomic revival, positive business outlook and business friendly policies of the new government are likely to alleviate growth in the coming years.
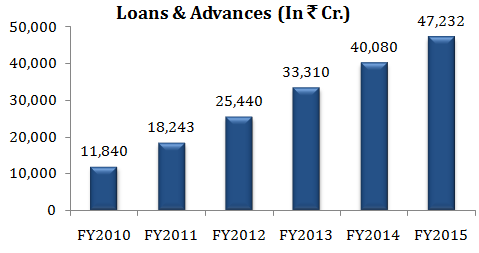
Robust Loan Growth
Over the last five years, L&T Finance’ loan book has grown at a CAGR of 32%. For the same period profit after tax grew at a CAGR of ~ 18 %. For financial year 2015, the Company reported a healthy 17.84 % loan growth with retail finance loan book at Rs. 24,993 Cr. as compared to Rs. 22,485 Cr. in FY 2014 and wholesale finance loan book at Rs. 22,238 Cr. as compared to Rs. 17,598 Cr. in FY 2014.
L&T Finance is making efforts to strengthen its presence in segments like housing finance, tractor, two-wheeler and microfinance in retail business and operating projects in roads and renewable energy sectors in the wholesale segment. With industrial activity picking up and an improvement in the overall investment climate, loan book of the Company is expected to grow by 25 % in the coming years (AS PER COMPANY EXPECTATIONS).
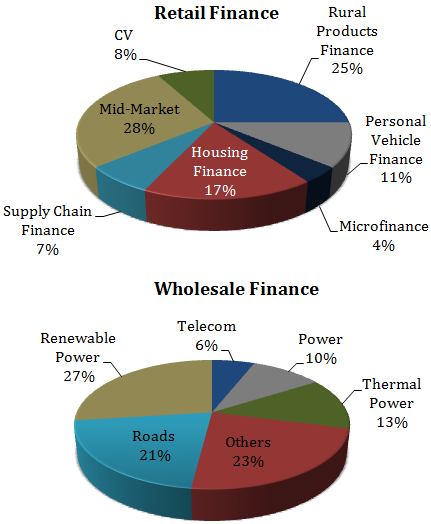
Composition of the Loan Book by Product Segment
Strong Parentage and Brand Equity of L&T
Larsen and Toubro (L&T) holds 72.9% stake in L&T Finance. L&T brand is one of the most well respected and trustworthy brand in India which has helped the Company in attracting new customers and talent and in accessing capital.
WHAT’S DRAGGING THE STOCK
Intense Competition
The Company operates in the highly competitive financial services industry. The Company faces an intense competition from public and private sector Indian commercial banks (Axis, Kotak, and HDFC) and from other financial institutions (IDFC, Shriram Transport, PTC Financial) which provide financial products or services similar to L&T Finance. Competition in the financial industry also depends on the policies of the government and RBI’s stance on interest rates, particularly the repo rate; Basel III norms; and the entry of new players into the industry.
Risk of Default and Non-Payment by Borrowers
As an NBFC, L&T Finance faces a high risk of default and non-payment by the borrowers. This adversely affects profitability and asset quality in the financial services sector. The total loan book stood at Rs. 47,232 Cr. as of March 31, 2015, comprising a mix of infrastructure and retail loans. As the size of loan portfolio of the Company grows there will be an increasing risk of defaults.
Retail Finance
| (In %) | FY 2012 | FY 2013 | FY 2014 | FY 2015 |
| Gross NPAs as a % of total outstanding loans | 1.22 | 2.50 | 3.42 | 2.99 |
| Net NPAs as a % of net outstanding loans | 0.66 | 1.33 | 2.22 | 1.40 |
Wholesale Finance
| (In %) | FY 2012 | FY 2013 | FY 2014 | FY 2015 |
| Gross NPAs as a % of total outstanding loans | 1.69 | 1.47 | 3.10 | 1.78 |
| Net NPAs as a % of net outstanding loans | 1.45 | 1.19 | 2.53 | 1.25 |
In addition, the microfinance segment of the Company poses the highest risk of default compared to other segments. Under microfinance category, the Company provides loans to fund small businesses which belong to the economically weaker segments of the society in rural India, having limited sources of income, savings and credit records, and who cannot provide the Company with any collateral or security for their borrowings.
______________________
** The stock analysis of L&T Finance including the financial report linked above, is for informational purpose only. This analysis should not be taken as a buy/sell recommendation. The circumstances of the company and the economic environment may have changed since the date of this stock analysis. For an updated list of the mid cap companies in India, visit here.