
IT stocks have gained investors attention this year amid improved prospects of Indian IT companies. Over a period of one month, Mid Cap IT stocks have surpassed the large cap peers in terms of return. In the post below I am discussing 3 Mid Cap IT stocks to buy right now.
[1] L&T INFOTECH
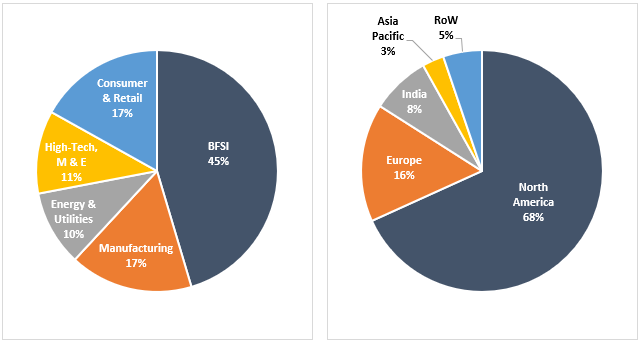
L&T Infotech Limited (“L&T Infotech” or the “Company”) is a global technology consulting and digital solutions Company helping more than 400 clients succeed in a converging world. Help the clients to accelerate their digital transformation with LTI’s Mosaic platform enabling their mobile, social, analytics, IoT and cloud journeys.
On an average, 95.90% of revenue comes from repeat business. Digital offerings, which accounted for over 25% of its revenue in FY17, increasing to over 40% in FY21
Service Offerings – Cloud Managed Services, AI, ML & IoT on Cloud, ERP on Cloud, Security on Cloud, Data and Analytics on Cloud. Mosaic Decisions, Mosaic AI, Mosaic Agnitio (For extracting data from unstructured documents and images to enable Intelligent Automation and Knowledge Mining), Leni (For interactive and investigative intelligence, allowing every user to ask and consume complex insights without human intervention)
| 2019 | 2020 | 2021 | |
| Application Development, Maintenance & Testing | 39.5% | 36.1% | 34.6% |
| Enterprise Solutions | 27.2% | 29.2% | 31.1% |
| Cloud Infrastructure & Security | 11.4% | 11.6% | 14.4% |
| Analytics, AI & Cognitive | 11.1% | 11.8% | 11.5% |
| Enterprise Integration and Mobility | 7.5% | 8.6% | 8.4% |
| Products and Platforms | 3.20% | 2.80% | – |
 Financial Performance
| Particulars | FY17 | FY18 | FY19 | FY20 | FY21 |
| Revenue (In Rs. Cr.) | 6,500.90 | 7,306.50 | 9,445.80 | 10,878.60 | 12,369.80 |
| Growth | – | 12.39% | 29.28% | 15.17% | 13.71% |
| EBITDA (In Rs. Cr.) | 1,230.20 | 1,187.40 | 1,883.30 | 2,029.30 | 2,725.10 |
| EBITDA Margin | 18.92% | 16.25% | 19.94% | 18.65% | 22.03% |
| EBIT (In Rs. Cr.) | 1,052.30 | 1,031.10 | 1,736.10 | 1,756.30 | 2,392.60 |
| EBIT Margin | 16.19% | 14.11% | 18.38% | 16.14% | 19.34% |
| PBT (In Rs. Cr.) | 1,235.80 | 1,441.50 | 2,027.80 | 2,002.90 | 2,588.20 |
| PAT (In Rs. Cr.) | 970.70 | 1,112.00 | 1,515.90 | 1,520.10 | 1,936.10 |
| PAT Margin | 14.93% | 15.22% | 16.05% | 13.97% | 15.65% |
| EPS (In Rs.) | 55.53 | 63.62 | 86.73 | 86.97 | 110.77 |
| EPS Growth Rate | – | 14.56% | 36.32% | 0.28% | 27.37% |
| Historic P/E (Closing Price of 31st March) | 12.58 | 21.18 | 17.52 | 18.54 | 29.98 |
| CURRENT P/E | 43.11 | ||||
| CURRENT PE/ROE | 1.63 | ||||
| PE/ROE | 0.41 | 0.74 | 0.57 | 0.66 | 1.13 |
| EV/Sales | 1.96 | 4.16 | 2.96 | 3.83 | 6.69 |
| D/E | 0.00 | 0.00 | 0.00 | 0.01 | 0.01 |
| Interest Coverage | NA | ||||
| ROCE | 39.11% | 30.75% | 38.48% | 37.32% | 37.08% |
| ROE | 30.87% | 28.81% | 30.98% | 28.13% | 26.51% |
[2] L&T TECHNOLOGY SERVICES LIMITED
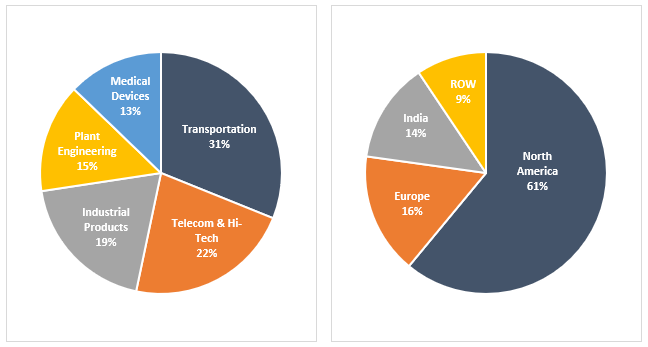
L&T Technology Services Limited (“L&T Tech” or the “Company”) is a global leader in Engineering and R&D (ER&D) services. The Company offers consultancy, design, development and testing services across the product and process development life cycle.
Its customer base includes 69 Fortune 500 companies and 57 of the world’s top ER&D companies, across industrial products, medical devices, transportation, telecom & hi-tech, and the process industries.
Service Offerings:
Transportation – LTTS is actively involved in the future of mobility through its solutions for electrical vehicles (EV), advanced driver assistance system (ADAS), and autonomous drive (AD)
Telecom and Hi-Tech – LTTS offers engineering services and solutions for five key segments: Telecom, Consumer Electronics, Semiconductor, ISV and Media & Entertainment. Provide digital services and solutions for Communications Service Providers, Networking and Technology System Operators, OEMs and Chipset Makers.
Industrial Products – The Industrial and Consumer Products practice in LTTS spans the entire value chain from design, development and deployment to monitoring, testing and automation of processes, products and solutions
Plant Engineering – LTTS is involved in every phase of a manufacturer’s plant lifecycle – from conceptualization to commissioning. LTTS takes a consulting-led approach to offer state-of-the-art digital solutions
Medical Devices – LTTS helps medical OEMs speed up product development cycles and shorten the time-to-market
With 69 Innovation and R&D design centers globally, the Company specializes in disruptive technology spaces such as 5G, Artificial Intelligence, Collaborative Robots, Digital Factory, and Autonomous Transport.
Financial Performance
| Particulars | FY17 | FY18 | FY19 | FY20 | FY21 |
| Revenue (In Rs. Cr.) | 3,248.30 | 3,747.10 | 5,078.30 | 5,619.10 | 5,449.70 |
| Growth | – | 15.36% | 35.53% | 10.65% | -3.01% |
| EBITDA (In Rs. Cr.) | 585.60 | 575.60 | 914.70 | 1,110.50 | 1,007.40 |
| EBITDA Margin | 18.03% | 15.36% | 18.01% | 19.76% | 18.49% |
| EBIT (In Rs. Cr.) | 523.10 | 486.80 | 810.50 | 927.60 | 789.10 |
| EBIT Margin | 16.10% | 12.99% | 15.96% | 16.51% | 14.48% |
| PBT (In Rs. Cr.) | 579.20 | 677.80 | 1,031.40 | 1,100.20 | 897.30 |
| PAT (In Rs. Cr.) | 424.90 | 506.00 | 765.60 | 818.60 | 663.30 |
| PAT Margin | 13.08% | 13.50% | 15.08% | 14.57% | 12.17% |
| EPS (In Rs.) | 40.44 | 48.16 | 72.87 | 77.92 | 63.14 |
| EPS Growth Rate | – | 19.09% | 51.30% | 6.92% | -18.97% |
| Historic P/E (Closing Price of 31st March) | 17.82 | 28.03 | 20.43 | 18.64 | 40.74 |
| CURRENT P/E | 58.21 | ||||
| CURRENT PE/ROE | 2.25 | ||||
| EV/Sales | 2.46 | 3.97 | 2.84 | 2.78 | 7.04 |
| D/E | 0.07 | 0.04 | 0.03 | 0.01 | 0.00 |
| PE/ROE | 0.46 | 0.80 | 0.49 | 0.47 | 1.58 |
| Interest Coverage | NA | ||||
| ROCE | 32.96% | 24.26% | 31.75% | 33.06% | 22.65% |
| ROE | 38.99% | 35.00% | 41.60% | 39.74% | 25.84% |
[3] TATA ELXSI LIMITED
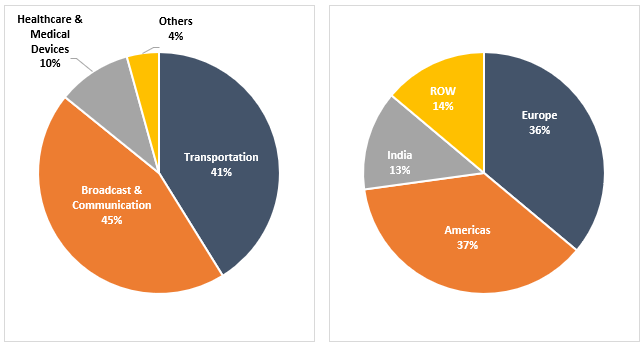
Tata Elxsi Limited (“Tata Elxsi” or the “Company”) is amongst the world’s leading providers of design and technology services across industries including Automotive, Broadcast, Communications, Healthcare, and Transportation. Tata Elxsi is helping customers reimagine their products and services through the application of digital technologies such as IoT (Internet of Things), Cloud, Mobility, Virtual Reality, and Artificial Intelligence.
Service Offerings:
System Integration and Support – implements and integrates complete systems and solutions for specialized applications such as Experience Centers, Training and Safety, and Design Visualisation. Helps customers implement complex design solutions across market segments such as Automotive, Aerospace, Entertainment, Manufacturing, Government, and Education
Industrial Design and Visualization – services span across consumer research and strategy, branding and graphics, product design, service design, user experience design, transportation design, 3D-prototyping, visualization, and manufacturing support.
Embedded Product Design (EPD) – provides technology consulting, new product design, development, and testing services for the Transportation, Media, Broadcast & Communication and Healthcare.
Fixed price contract accounts for 45.4% to revenue
| 2019 | 2020 | 2021 | |
| System Integration & Support | 85.6% | 87.3% | 88.2% |
| Industrial Design & Visualization | 10.4% | 9.7% | 9.3% |
| Embedded Product Design | 4.0% | 3.0% | 2.5% |
Financial Performance
| Particulars | FY17 | FY18 | FY19 | FY20 | FY21 |
| Revenue (In Rs. Cr.) | 1,237.31 | 1,386.30 | 1,596.93 | 1,609.86 | 1,826.16 |
| Growth | – | 12.04% | 15.19% | 0.81% | 13.44% |
| EBITDA (In Rs. Cr.) | 296.59 | 346.01 | 415.04 | 343.00 | 522.41 |
| EBITDA Margin | 23.97% | 24.96% | 25.99% | 21.31% | 28.61% |
| EBIT (In Rs. Cr.) | 269.67 | 320.66 | 389.94 | 299.59 | 478.03 |
| EBIT Margin | 21.79% | 23.13% | 24.42% | 18.61% | 26.18% |
| PBT (In Rs. Cr.) | 264.26 | 363.91 | 433.40 | 352.44 | 511.87 |
| PAT (In Rs. Cr.) | 174.78 | 240.04 | 289.97 | 256.10 | 368.12 |
| PAT Margin | 14.13% | 17.32% | 18.16% | 15.91% | 20.16% |
| EPS (In Rs.) | 28.07 | 38.54 | 46.56 | 41.12 | 59.11 |
| EPS Growth Rate | – | 37.34% | 20.80% | -11.68% | 43.74% |
| Historic P/E (Closing Price of 31st March) | 26.87 | 24.99 | 15.41 | 21.33 | 50.84 |
| CURRENT P/E | 74.50 | ||||
| CURRENT PE/ROE | 1.97 | ||||
| EV/Sales | 3.78 | 5.42 | 2.23 | 3.30 | 14.55 |
| D/E | 0.00 | 0.00 | 0.00 | 0.00 | 0.00 |
| PE/ROE | 0.57 | 0.51 | 0.34 | 0.66 | 1.34 |
| Interest Coverage | NA | ||||
| ROCE | 48.36% | 43.43% | 41.36% | 27.48% | 35.35% |
| ROE | 47.39% | 49.29% | 45.97% | 32.33% | 37.86% |
Thanks. Can you clarify what “CURRENT PE/ROE” will tell us? and where we can apply?
It’s a ratio we have come up with to assess the valuation of the share. A high PE of its own does not mean company is highly valued. Has to be seen in relation to what ROE the company is earning. A high PE on a high ROE makes the company cheaper as compared to a high PE on a low ROE. Similarly a high PE on a high ROE company is preferable to a low PE on a low ROE.
Thus a company with a PE/ROE <1 and ROE > 20% is worth evaluating. If you apply this test you will see automatically companies such as HUL, Colgate etc come out on top