
By now all of you would have looked at a gazillion charts and tables trying to relate Nifty’s 10-20 year average PE and comparing that to where we are today. Naturally, we have been in a very very expensive market for far too long. Markets have been running up with no earnings support whatsover. At some point, the mismatch between earnings and stock prices will become right and if that happens anytime in the next 1 year, then we will see a significant decline from the current levels. I expect markets to fall gradually by another 10% before the end of FY 2020.
Click on the image below to expand. PE multiple is as it prevailed on the 1st of January of each year. Returns are Calendar year returns.
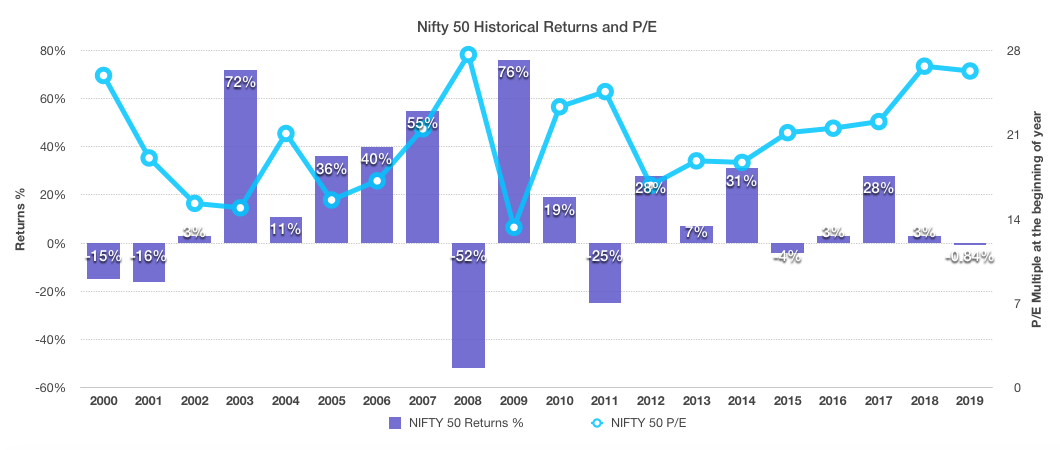
Look at the chart above, and notice
1. Between 2000 – 2009 period – the market went up by more than 35% in 5 out of 10 years and the PE multiple remained volatile.
2. 2010 – 2019 period – the market reamained flat. Not even once did they come close to generating 35% in a single calendar year. PE multiple remained continuously inflated and equally flat.
Just looking at this chart it becomes clear that for markets to rise in any meaningful way, the PE multiple has to fall. This can happen only if earnings improve drastically or if stock prices fall equally drastically. Or, if both happen gradually over a period of time. Market has been hoping for this last option for a few years.
Also See: Nifty 50 Earnings, Q1 FY 2020 Analysis
In any event whether or not earnings imprve or stock prices fall, one thing is clear:
While downside to this market remains heavy; in the prevailing environment of slowdown and global trade wars, it is hard to come up with reasons why this market should rise anytime soon. I do however believe that there is significant mismatch between lthe Nifty and the midcap and small cap indices. In latter case, valuations falling close to or below thier average lows for the past 20 years. Though the average itself is higher given how long we have stayed overvalued.
| Year | Nifty Opening Value | % Returns | Nifty P/E Multiple- 1 January |
| 1999 | 886.75 | 67% | 11.62 |
| 2000 | 1482.15 | -15% | 25.91 |
| 2001 | 1263.5 | -16% | 19.06 |
| 2002 | 1058.85 | 3% | 15.29 |
| 2003 | 1093.6 | 72% | 14.92 |
| 2004 | 1880.35 | 11% | 21.09 |
| 2005 | 2080 | 36% | 15.57 |
| 2006 | 2836.8 | 40% | 17.16 |
| 2007 | 3966.25 | 55% | 21.48 |
| 2008 | 6136.75 | -52% | 27.64 |
| 2009 | 2963.3 | 76% | 13.3 |
| 2010 | 5200.9 | 19% | 23.31 |
| 2011 | 6177.45 | -25% | 24.57 |
| 2012 | 4640.2 | 28% | 16.79 |
| 2013 | 5937.65 | 7% | 18.82 |
| 2014 | 6323.8 | 31% | 18.69 |
| 2015 | 8272.8 | -4% | 21.16 |
| 2016 | 7938.45 | 3% | 21.53 |
| 2017 | 8210.1 | 28% | 22.08 |
| 2018 | 10531.7 | 3% | 26.68 |
| 2019 | 10881.7 | -0.84% | 26.28 |
Hi Rajat ,
https://www.sanasecurities.com/impact-of-corporate-tax-reduction-on-nifty-pe-multiple/
“On 24th September 2019, based on previous EPS TTM, Nifty PE multiple was at 28.49. Considering, the change in EPS TTM after tax cut, new Nifty PE multiple comes to be 20.49.”
As per above above statement , Do you mean that market is become fairly valued ?
After corporate Tax reduction , NIFTY PE fall from 27-28 to 20..So one can consider the current NIFTY valuation is normal and at this valuation one can think of investing in share market for long term ?
As per image for NIFTY PE and NIFTY-50 Return , looks like Investment has given good returns when NIFTY PE is 20 or below.
I am not sure whow you are calculating these numbers. It can not be 20 at this price.