The Nifty Price/ Earnings Ratio or the Nifty PE ratio is almost certainly the best buy / sell indicator for anyone who believes in buying good companies at cheap valuations. The way to calculate the Nifty PE Ratio is not any different from how the PE Ratio of a stock is calculated.
Nifty PE Ratio
Nifty PE ratio is calculated by dividing the sum of market capitalization by the sum of earnings of all companies which constitute the S&P CNX Nifty. The important thing to keep in mind is to work with consolidated earnings uniformly for all companies. Financial websites (even the most popular ones) often report erroneous PE multiple both for a stock and for the index as a whole. For more on this – see towards the end of this article: Index wide PE calculation – Sensex and Nifty PE.
You do not have to put much effort in calculating the Nifty PE Ratio. NSE’s website has a tool which calculates PE and other basic ratios across Indices (click here).
What the Nifty PE Ratio Indicates
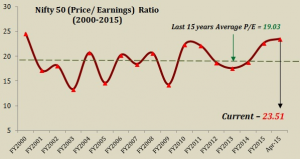
Naturally the ratio is a measure of how expensive the overall markets are at any given point of time. On the whole this ratio serves as a great indicator especially when you compare it against the average number for the last 10 – 15 – 20 or so years.
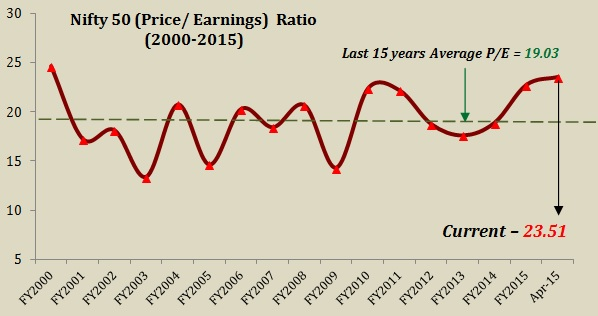
At 23.51, the Nifty PE is almost close to its 15 year peak level (as on 10 April 2015).
Keep in mind that this ratio is based on two variable – (a) price of the stock; and (b) earnings. Whenever price moves faster in relation to earnings, the PE number will go up. Over the past 8-12 months Indian stock markets have witnessed what can best be described as a ‘rally of hope’. While stock prices have become expensive with the markets rallying over 25 %, the underlying earnings have not improved. In fact they are yet to be reported for a full year.
Having witnessed such performance in the absence of any proof of fundamental improvement, one might ask: what then has been driving the markets? Even if the government’s schemes, proposals and future plans all yield the desired results, it should take at least a few years before earnings start improving on that basis.
But again, like a wolf behind the rabbit, optimism is always many leaps ahead of reality. How long will such situation continue is anybody’s guess. While one might argue that nothing suggests a crash right now; the truth is that nothing ever suggests a crash other than hindsight.
My View on the Overall Nifty Valuation
I believe that over the next 4-8 quarters the markets will go up and down in 10-15 % range – i.e. 25,000 – 30,000 range. If I must, I will speculate with some downside bias. I do however believe that eventually the earning cycle will improve which is when the markets should break out in a meaningful way.
Also Read: Relationship between stock prices and the real economy
What is a Good Investment Strategy Right Now?
In past I have written much about high commission and expense charges which you end up paying when you invest via mutual funds. As someone who invests in equities directly, I may have a bias on this subject. Having said that, I have always maintained that for a majority of individuals it is far more sensible to invest in mutual funds than to try and invest on their own. I say this not because such funds are managed by specialist investment managers but more because they follow money markets far more closely and hence are able to move money between asset classes faster and more effectively.
To give you an example, a few days back I met my friend Navneet who is an Associate Directors with IDFC Asset Management Company. We discussed our short and long term views on the market. I shared my above view with him.
In return what he shared with me was an interesting study they did. Look at the image below:
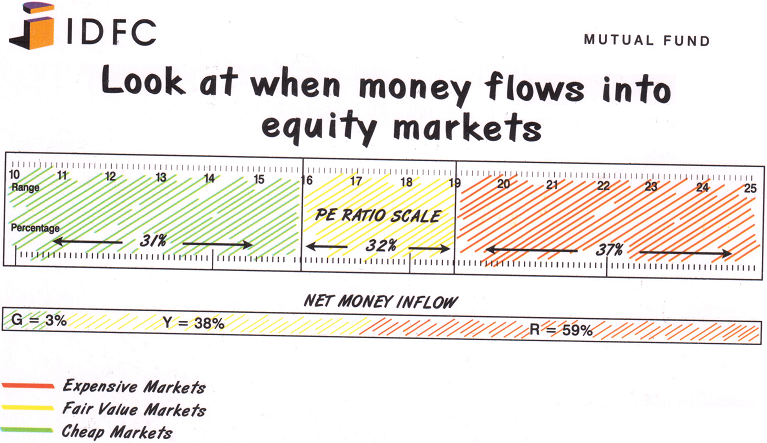
Maximum money flows into mutual funds when Nifty is in the red zone i.e. when Nifty PE multiple is in the 19-25 zone – expensive markets. Fewer people invest when the multiple is in the 10-15 range – cheap markets.
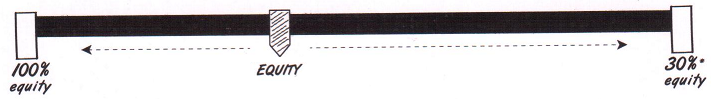
To deal with this anomaly of human behavior some funds maintain the ability to move money in-and-out of equity as per the market valuation. At any given point such funds have anywhere between 30% – 100% exposure to equities. More expensive the market, lesser allocation they make to equities thereby increasing their exposure to other asset classes like fixed income and debt products.
 This ability to effectively switch between equity and other asset classes make mutual funds attractive for anyone who can not devote enough time to investment research.
IMPORTANT NOTE
Each mutual fund scheme is different in terms of its strategy, objective and asset allocation. It is important that you understand the product carefully before allocating money to it. The above example does not explain how mutual funds operate in general and is very specific to the strategy followed by one particular fund.
Whether you decide in favor or against buying mutual funds, the probability of success depends largely on your understanding of the product and more importantly on understanding your own personal goals and risk profile. Discuss these aspects carefully with a neutral investment adviser before investing.
Good…
Thanks Pranav. That’s the shortest comment I have received on a post.
So the level for nifty @19 PE is around 7200?
Yes, you are right – unless of course the earnings start improving. Both of which (- earnings improving and market falling to 7200) are realistic. My only point in the article was that 9000 was almost as expensive as the market had been over the last 15 years.
what is your view on the current levels sir….invest?
To be honest, the investing I believe in – there is always an opportunity. Buy selectively. Hold forever 🙂
Sir,
Greetings,
No Nifty current PE ratio chart on your web site?
Current PE ratio of Nifty is 21.20. Your web site shows 23.51.
Can we have up dated PE on daily or weekly basis.
Check the attached link to NSE’s website you will get it live there. That is what I explained in the post 🙂
Excellent analysis I follow the same entered at 7250 with 40% capital rest will deploy at 15 pe or less will hold till next bull run. Whats ur view when to expect pe 15 or below.
Hope no time soon 🙂
the article is old. what about current PE levels and accordingly advice on investments in equity
now I know why people lose money in stocks, they enters market when party is already over.
Hahahaha
Top analysis!
Hi Rajat,
With Coronavirus impacting major countries, the Indices are moving in southward journey.
What would be the Nifty 50 PE for 9 months ended December 2019 ?
Can we discount the next 3 months as virtually no sales and no profits and then come to the conclusion of Nifty 50 PE… Because already Nifty and Banknifty have fallen by more than 30 percent from their recent HIGHs.
If we assume that companies registered sales and profits for Jan 2020, Feb 2020, but for Mar, April and May 2020 there will be no sales and profits, then we take only 9 months EPS for all Nifty 50 stocks and come to the PE valuations.
Would that be attractive or that Nifty needs to correct further ?