NIIT Technologies Limited (“NTL” or the “Company”) was set up in April 2003, when NIIT Ltd (NIIT) spun off its software solutions business (excluding knowledge solutions) into a separate legal entity. NIIT holds 25% stake in NTL through a wholly owned subsidiary, Scantech Evaluation Services Ltd.
Date – 9th July 2018
Price – Rs. 1091.20
NIIT Technologies is a global IT solutions organization addressing the requirements of clients across the Americas, Europe, Asia, and Australia. Differentiated on its domain strength, NIIT Technologies services clients in travel and transportation, banking and financial services, insurance, manufacturing, and media verticals, offering a range of services including application development and maintenance, infrastructure management, and business process management. Focused on Digital Services, the Company is helping businesses design agile, scalable, and digital operating models.
Financial Position
| PARTICULARS | FY15 | FY16 | FY17 | FY18 |
| Revenue from operations | 2,372.50 | 2,682.40 | 2,802.10 | 2,991.40 |
| Total Expenses | 2,036.63 | 2,206.49 | 2,322.60 | 2490.1 |
| EBIDTA | 335.87 | 475.91 | 479.5 | 501.30 |
| Depreciation & amortization expenses | 91.64 | 110.13 | 127.7 | 127.4 |
| EBIT | 244.23 | 365.78 | 351.8 | 373.90 |
| Finance Costs | 5.67 | 4.88 | 6 | 9.4 |
| Other Income | 17.31 | 20.55 | 26.9 | 39.1 |
| Profit Before Exceptional Items | 255.87 | 381.45 | 372.7 | 403.60 |
| Exceptional Items | -79.96 | -1.32 | -22.1 | 0 |
| PROFIT BEFORE TAX | 335.83 | 382.77 | 350.6 | 403.60 |
| Total Tax Expenses | 54 | 83.18 | 78.5 | 94.9 |
| PROFIT AFTER TAX | 281.83 | 299.59 | 272.1 | 308.70 |
| Earnings Per Share | 24.25 | 31.75 | 40.71 | 45.34 |
Profitability Ratios
| PARTICULARS | FY15 | FY16 | FY17 | FY18 |
| EBIDTA Margin | 14.16% | 17.74% | 17.11% | 16.76% |
| Net Profit Margin | 11.88% | 11.17% | 9.71% | 10.32% |
Balance Sheet
| PARTICULARS | FY15 | FY16 | FY17 | FY18 |
| Share Capital | 61.04 | 61.19 | 61.40 | 61.5 |
| Reserves and Surplus | 1,296.30 | 1,529.56 | 1,625.10 | 1712.5 |
| Net Worth | 1,357.34 | 1,590.75 | 1,686.50 | 1774.0 |
| Minority Interest | 18.87 | 64.52 | 23.70 | 22.2 |
| Long Term Borrowings | 4.85 | 6.38 | 7.40 | 17.9 |
| Deferred Tax Liabilities | – | – | 38.70 | 45.5 |
| Long Term Provisions | 33.85 | 84.79 | 249.60 | 225.5 |
| Current Liabilities | 561.80 | 502.69 | 458.90 | 584.7 |
| Total Liabilities | 1,976.71 | 2,249.13 | 2,464.80 | 2669.8 |
| PARTICULARS | FY15 | FY16 | FY17 | FY18 |
| Tangible Assets | 454.09 | 523.45 | 480.20 | 450.7 |
| Intangible Assets | 224.11 | 313.73 | 367.40 | 429.3 |
| Long Term Loans And Advances | 61.88 | 91.61 | – | – |
| Other Non-Current Assets | 51.57 | 42.89 | 129.60 | 171.9 |
| Total Current Assets | 1,185.08 | 1,277.43 | 1,487.60 | 1617.9 |
| Total Assets | 1,976.73 | 2,249.11 | 2,464.80 | 2669.8 |
Efficiency Ratios
| PARTICULARS | FY15 | FY16 | FY17 | FY18 |
| Return on Equity | 20.76% | 18.83% | 16.13% | 17.40% |
| Return on Capital | 17.68% | 22.01% | 20.48% | 20.61% |
WHAT’S DRIVING THE STOCK
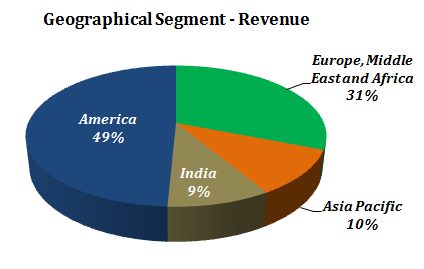
Diversified Revenue Mix across Geographies and Industry Verticals
NTL has a geographically diverse revenue profile with focus on application development and maintenance (ADM) services in: Banking and Financial Services Industry (BFSI), manufacturing and distribution, travel and transportation, and government verticals. The Company also offers IT-enabled services (ITeS) and geographic information system (GIS) solutions through its subsidiaries, NIIT Smart Serve Ltd and NIIT GIS Ltd, respectively.
| Verticals | FY16 | FY17 | FY18 |
| Travel & Transportation | 35% | 32% | 27% |
| Insurance | 21% | 23% | 26% |
| Banking and Financial Services | 17% | 19% | 17% |
| Government | 4% | 3% | 1% |
| Manufacturing, Media and Others | 23% | 23% | 29% |
Acquisitions have helped strengthen position in existing verticals or supported foray into new ones, apart from expanding the client base and reducing client concentration. Furthermore, NTL has a geographically diverse revenue profile which insulates it from downturns in any single geography.

Organization Restructuring:
The Company has restructured from a geo-centered organization to a vertical-centered organization, which has been formed around three key verticals of Travel & Transportation, Insurance and BFS. Within the restructured organization:
- Existing services of IMS, BPM, Data/Automation and Cloud will feed into these verticals.
- The positioning for superior growth is that of focus and differentiation in select sub-segments, thanks to a combination of domain and delivery expertise in order to command NTL’s right to win. These include a wide spectrum of domain-delivery expertise in Travel / Transportation (Airlines, Airport & Cargo, Road and Railways). In BFS, this specialization is in the Wealth and Asset Management sub-segment, and in Insurance, the thrust on Digital is in the non-life commercial reinsurance space.
- It has also added new teams that will contribute as additional sales vectors: A separate large-deals-focused sales organization, new partnerships and alliances organization, new service lines of cloud, RPA and Data services, and lastly, CTO organization to focus on Blockchain, IoT and Artificial Intelligence.
Digital Integration is Leading the Way
- For NIIT Technologies, Digital is defined in four key buckets: [1] Digital Experience, [2] Data and Analytics, [3] Digital Integration and [4] Emerging technologies.
- The acquisitions of Incessant and Ruletek have driven the Digital integration segment for Pega and Appian, which have been among the key growth drivers for NITEC.
- The Company now boasts of 700+ people capable in Pega and Appian already, even though these products are still nascent (USD850m and USD200m revenues respectively)
- The segment grew 16% QoQ in 2QFY18, 13% in 3Q and 22% in 4QFY18, having added 50%+ revenues from 1Q to 4Q.
WHAT’S DRAGGING THE STOCK
Weak Financial Risk Profile
Deterioration in financial risk profile and weakening of healthy liquidity, most likely due to large debt-funded capex or acquisitions
Exposure to Intense Competition in IT Industry
The business environment remains challenging. Indian IT players will need to scale up their operations, primarily due to intense competition among themselves and from multinational corporations that are expanding their offshore operations in India. Other key success factors include acquiring and retaining new customers, maintaining an efficient cost structure, and ensuring effective labour retention and utilization.
Protectionist measures adopted by the US remain yet another business challenge for Indian IT companies. However, players are likely to effectively counter challenges backed by the Indian IT industry’s inherent strengths.The Company has a scale disadvantage with respect to that of larger players in the industry (scale of operations largely determines a player’s ability to bid for large orders successfully). Furthermore, a large scale of operations ensures that the company is not impacted by shocks to particular clients, verticals or geographies resulting in slower revenue growth or a decline in profitability