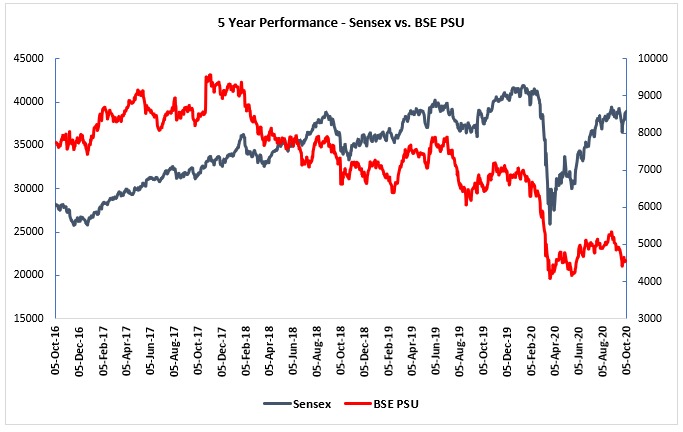
The BSE PSU stocks index has massively underperformed the benchmark S&P BSE Sensex in the past five years.
While the BSE Sensex has appreciated 49.4% (from 27079.51 to 40433.52), the BSE PSU Index has fallen 34.7% (from 6955.32 to 4535.22). The BSE Sensex now trades at 185% premium to the price-book (P/B) multiple of the BSE PSU stocks index compared with the 10-year average premium of 107%.
BSE PSU Index, which comprises 60 stocks, has fallen 35% since 1 January 2020. That compares with the 1.5% fall in the benchmark Sensex in the same period.

One Year Stock Performance of Companies in BSE PSU Stocks Index
Over the last one year, some of the companies have lost as much as 35-55% of their market value. The NPA laden PSU Banks and declining oil prices have contributed to the fall.
| Company Name | Price as on 5th Oct 2019 | Price as on 5th Oct 2020 | One Year Price Change |
| SBI | 249.10 | 189.4 | -23.97% |
| ONGC | 126.55 | 68.7 | -45.71% |
| Power Grid Corp | 196.50 | 164.5 | -16.28% |
| NTPC | 115.95 | 84.25 | -27.34% |
| BPCL | 490.65 | 355.2 | -27.61% |
| Coal India | 184.40 | 118.05 | -35.98% |
| IOC | 148.70 | 74.6 | -49.83% |
| GAIL | 130.20 | 86.65 | -33.45% |
| Hindustan Aeronautics | 691.25 | 801 | 15.88% |
| HPCL | 307.35 | 175.25 | -42.98% |
| PNB | 57.25 | 28.3 | -50.57% |
| NMDC | 91.55 | 83.05 | -9.28% |
| Power Finance | 94.65 | 88.2 | -6.81% |
| Bharat Electronics | 104.35 | 95.05 | -8.91% |
| General Insurance | 218.50 | 129 | -40.96% |
| IRCTC | 727.75 | 1,369.30 | 88.16% |
| Container Corp | 573.80 | 353.7 | -38.36% |
| Gujarat Gas | 173.90 | 311.8 | 79.30% |
| NHPC | 22.85 | 20.2 | -11.60% |
| Union Bank | 49.60 | 24.55 | -50.50% |
| Bank of Baroda | 87.25 | 42.15 | -51.69% |
| New India Assurance | 101.95 | 107 | 4.95% |
| IOB | 9.60 | 9.27 | -3.44% |
| SAIL | 32.15 | 35.35 | 9.95% |
| Bank of India | 59.50 | 40.95 | -31.18% |
| Canara Bank | 179.40 | 91.65 | -48.91% |
| UCO Bank | 12.15 | 12.2 | 0.41% |
| ITI | 82.05 | 129.9 | 58.32% |
| BHEL | 42.80 | 29.5 | -31.07% |
| Oil India | 143.60 | 88.05 | -38.68% |
| SJVN | 23.95 | 21.85 | -8.77% |
| Central Bank | 17.45 | 13.95 | -20.06% |
| Bank of Maharashtra | 11.00 | 11.36 | 3.27% |
| NLC India | 54.10 | 50.5 | -6.65% |
| Indian Bank | 118.80 | 58.2 | -51.01% |
| HUDCO | 32.55 | 32.65 | 0.31% |
| RITES | 261.20 | 253.6 | -2.91% |
| NALCO | 44.55 | 32.5 | -27.05% |
| Bharat Dynamics | 285.00 | 321.2 | 12.70% |
| MRPL | 49.65 | 26.7 | -46.22% |
| Cochin Shipyard | 330.25 | 334.8 | 1.38% |
| NBCC (India) | 32.50 | 23.9 | -26.46% |
| Engineers India | 106.90 | 64.95 | -39.24% |
| Ircon International | 72.69 | 80.1 | 10.19% |
| Mishra Dhatu Ni | 122.45 | 196.7 | 60.64% |
| MOIL | 132.50 | 141.65 | 6.91% |
| Hind Copper | 31.65 | 33.2 | 4.90% |
| BEML | 937.15 | 610.6 | -34.85% |
| Garden Reach Shipping | 172.55 | 220 | 27.50% |
| MMTC Ltd | 15.65 | 16.4 | 4.79% |
| Shipping Corp | 39.05 | 52.65 | 34.83% |
| Rashtriya Chem | 44.20 | 44.45 | 0.57% |
| India Tourism Development | 235.05 | 238.6 | 1.51% |
| Balmer Lawrie | 110.77 | 103.6 | -6.47% |
| Guj Mineral | 58.05 | 43.3 | -25.41% |
| IFCI | 6.80 | 6.1 | -10.29% |
| JK Bank | 32.20 | 15.55 | -51.71% |
| Chennai Petro | 165.10 | 69.7 | -57.78% |
Are PSU stocks attractively priced?
Considering Price-to-Earnings Ratio (P/E) as a valuation metric, PSU Stocks have become cheap. Out of 58 BSE PSU constituents, 24 offer a dividend yield of over 4% and 19 trade below PE multiple of 10.
In the table below, we have mentioned companies with the highest dividend yield (above 4%)
| Company Name | Dividend Yield (%) | PE (x) |
| NLC India | 13.93 | 4.72 |
| Oil India | 12.15 | 3.15 |
| Power Finance | 10.67 | 3.09 |
| Coal India | 10.15 | 5.15 |
| SJVN | 10.07 | 5.59 |
| HUDCO | 9.44 | 4.18 |
| Engineers India | 7.94 | 11.85 |
| NHPC | 7.39 | 7.5 |
| ONGC | 7.27 | 21.5 |
| GAIL | 7.23 | 4.69 |
| Balmer Lawrie | 7.2 | 15.48 |
| Rashtriya Chem | 6.39 | 11.25 |
| NMDC | 6.38 | 8.65 |
| RITES | 6.34 | 10.86 |
| Power Grid Corp | 6.11 | 8.07 |
| Ircon International | 5.93 | 2.01 |
| IOC | 5.72 | – |
| HPCL | 5.61 | 6.6 |
| Cochin Shipyard | 4.97 | 7.94 |
| Guj Mineral | 4.66 | 5.59 |
| BPCL | 4.63 | 22.31 |
| NALCO | 4.62 | 108.5 |
| MOIL | 4.26 | 20.89 |
| Hindustan Aeronautics | 4.17 | 10.73 |
The price correction in case of many PSU stocks is justified by the variety and magnitude of challenges they have been facing. But we believe that there are many companies operating with economic and business advantages and are trading at attractive valuations. There is a lot of value in fundamentally strong PSU stocks, given their recent price correction. Further, since dividend yields of some of these stocks are so attractive, investors can consider investing in them for regular dividends.
We believe that it is time to look for cash-rich PSUs with a good track records of dividend yields. Below 5 high dividend yield stocks look attractive at current levels.
[1] ONGC – ONGC (“ONGC” or the “Company”) is the second largest oil and gas exploration and production company in the world and ranks 23rd among leading global energy majors. ONGC has consistently been among the top dividend paying companies in India.
Dividend History – The Company has maintained an average dividend yield of 5.04 % over the last 5 financial years. At current price (5 October, 2020), ONGC has a dividend yield of 7.27 %.
| FY 2016 | FY 2017 | FY 2018 | FY 2019 | FY 2020 | |
| Dividend per share | 8.50 | 6.05 | 6.60 | 7.00 | 5.00 |
| Share Price | 142.74 | 185 | 177.8 | 159.75 | 63.35 |
| Dividend Yield | 5.95% | 3.27% | 3.71% | 4.38% | 7.89% |
[2] Coal India – Coal India (“Coal India” or the “Company”) is the single largest coal producer in the world. The Company operates through its subsidiaries in 84 mining areas spread over eight (8) states of India. Coal India Limited has 352 mines (as on 1st April, 2020) of which 158 are underground, 174 opencast and 20 mixed mines.
Dividend History – The Company has maintained an average dividend yield of 7.31 % over the last 5 financial years. At current price (5 October, 2020), Coal India has a dividend yield of 10.15 %.
| FY 2016 | FY 2017 | FY 2018 | FY 2019 | FY 2020 | |
| Dividend per share | 27.40 | 19.90 | 16.50 | 13.10 | 12.00 |
| Share Price | 292 | 292.8 | 283.5 | 236.8 | 133.25 |
| Dividend Yield | 9.38% | 6.80% | 5.82% | 5.53% | 9.01% |
[3] SJVN – Beginning with a single project and single State operation (i.e. India’s largest 1500 MW Nathpa Jhakri Hydro Power Station in Himachal Pradesh), SJVN has commissioned seven projects totaling 2016.51 MW of installed capacity and 86 km 400 KV Transmission Line. SJVN aims to be a 5000 MW company by 2023, 12000 MW company by 2030 and 25000 MW company by 2040. Presently, total portfolio of SJVN is 7690.51 MW, out of which 2016.51 MW is under operation, 2980 MW is under Construction, 482 MW is under Pre-construction & Investment Approval and 2212 MW is under Survey and Investigation stage.
Dividend History – The Company has maintained an average dividend yield of 7.59 % over the last 5 financial years. At current price (5 October, 2020), SJVN has a dividend yield of 10.07 %.
| FY 2016 | FY 2017 | FY 2018 | FY 2019 | FY 2020 | |
| Dividend per share | 1.10 | 2.75 | 2.10 | 2.15 | 2.20 |
| Share Price | 28.65 | 33.85 | 33.35 | 24.2 | 20.35 |
| Dividend Yield | 3.84% | 8.12% | 6.30% | 8.88% | 10.81% |
[4] Bharat Electronics – Bharat Electronics (“BEL” or the “Company”) is an Indian state-owned aerospace and defence company with about nine factories, and several regional offices in India. The Company primarily manufactures advanced electronic products for the Indian Armed Forces. Defence contributes nearly 80 to 85% to BEL’s revenue.
Dividend History – BEL has maintained an average dividend yield of 2.01 % over the last 5 financial years. At current price (5 October, 2020), BEL has a dividend yield of 2.94 %.
| FY 2016 | FY 2017 | FY 2018 | FY 2019 | FY 2020 | |
| Dividend per share | 1.70 | 2.25 | 2.00 | 3.40 | 2.80 |
| Share Price | 143.17 | 185.05 | 177.8 | 159.55 | 63.45 |
| Dividend Yield | 1.19% | 1.22% | 1.12% | 2.13% | 4.41% |
[5] Engineers India – Engineers India (“EIL” or the “Company) is a leading global engineering consultancy and EPC company. The Company provides engineering consultancy and EPC services principally focused on the oil & gas and petrochemical industries. EIL has an impressive record of executing over 5000 assignments consisting of 400 major projects valued over US$200 Billion.
Dividend History – The Company has maintained an average dividend yield of 4.28% over the last 5 financial years. At current price (5 October, 2020), EIL has a dividend yield of 7.94 %.
| FY 2016 | FY 2017 | FY 2018 | FY 2019 | FY 2020 | |
| Dividend per share | 4.00 | 3.00 | 4.00 | 4.00 | 5.15 |
| Share Price | 85.05 | 143.95 | 158.45 | 117.3 | 59.4 |
| Dividend Yield | 4.70% | 2.08% | 2.52% | 3.41% | 8.67% |
Disclaimer: Do not treat this as a buy or sell recommendation. The dividend yields are likely to fall.
In depth work. Futuristic
Feldene https://pharmacyken.com/ – canadian pharmacy prices canadian pharmacy coupon