Every time the stock market rises by a few percentage points, people start flocking to invest in stocks. More the market rises, more people start joining in. This has remained a mystery to me and to all those who believe in value investing.
You will find value when the worth of a business falls below the trading price of its shares. Why then would you get excited about a rise in the trading price? On the contrary, the fact that the trading price of a share has already risen is in fact the dumbest reason to buy a stock; does the share then not offer lesser value?
There are many different approaches to stock investing and they all work. No one approach is better or worse than the other. You must choose your style of investing based on your investing goals, risk profile and to large extent based on how much time are you willing to spend in the markets. Technicians (those who believe in technical analysis and study human behavior) spend pretty much all day looking at the screen. They have little to do with the underlying businesses and are focused primarily on human behavior as depicted on chart patterns. Fundamental analysts on the other hand focus on buying shares in high quality businesses and typically hold on to their investments for a longer period of time. There are momentum investors and those who buy and sell based on anticipation of future events in the short term, and others who trade on the basis of up to the minute information flow.
The most important rule for all stock investing approaches –
Make sure that your style of investing is not based on a hybrid mix of all these styles because that is an almost sure way of doing harm to your portfolio sooner than later.
Risk free stock investing – Beating the line Rule
The method that I will explain below is used by many stock investors to not only make profits in the short to medium term but also to accumulate good solid shares for the long term.
Before you think of following this rule, remember:
- Buying low and selling high – it is not technical or fundamental analysis or for that matter based on any market principle, other than that – stock prices move in both directions.
- Your only friend in this model is TIME – if you have time on your side (i.e. you can stay invested for long), you will be able to beat the markets 8 out of 10 times, the 2 times you will miss out is when the stock crashes completely and never recovers.
Ideally, you should follow this rule for well established large cap stocks – the shares of which you will be happy to hold on for a long time. In that sense it is fundamental research refined on the back of a careful study of financial results and market dynamics, including news flows and economic outlook.
Example – Let me explain this point further with the actual market price of a fundamentally strong stock. Below, I take the historic trading price of Tata Motors stock for the stated period.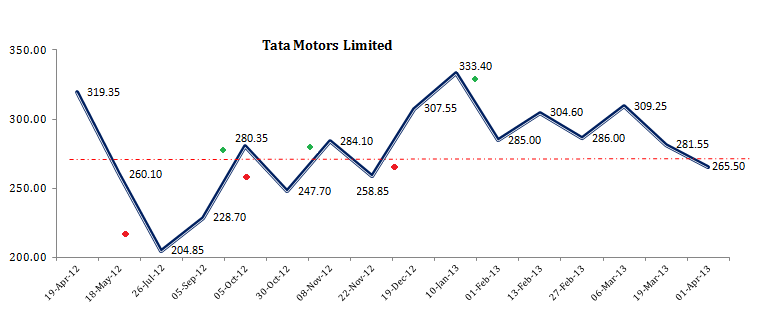
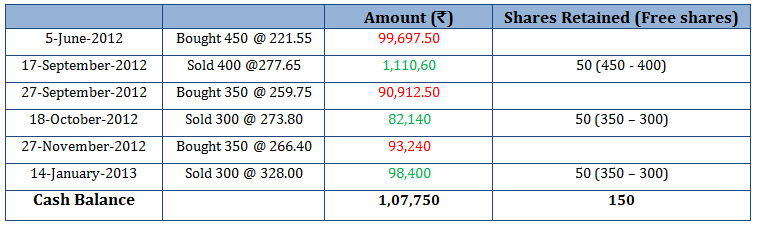
Let’s say you were investing Rs. 1,00,000/- and you bought and sold as below:
 The point is that you need not be precisely right about buying at the bottom and selling at the peaks. So long as you manage to buy anywhere below the median value line (the imaginary red-dotted line in the chart above) and are able to sell anywhere above it, you will accumulate shares and make profit.
In the above scenario, you could manage to accumulate 150 shares and make a cash profit of Rs. 7,750 in 4 months. All of this with an investment of Rs. 1,00,000.
You can even calculate your total profit as Rs. 7,750 + the current market price of 150 shares. (i.e Rs. 63,300 @ current market price of Rs. 422 as of 14th April 2014).
Criticism
Like most things, this method of investing has its pros and cons. One big problem with this model is that it completely ignores the principle of ‘Time value’.
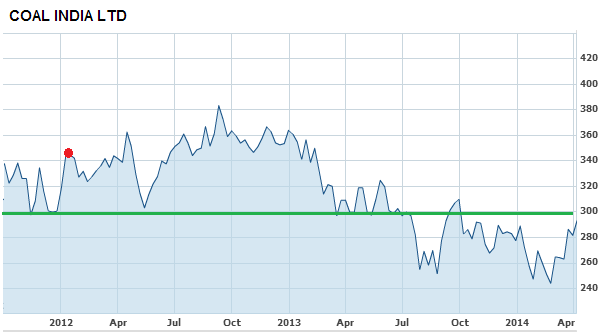 It is true that with time, the share prices of fundamentally strong companies are most likely to rise. However, at times the prices remain stagnant for a long period of time. For example – Coal India Limited has been trading in the range of Rs. 260 – 360 for over 2 years. Even if it were to move to Rs. 400 in the next few months and you sold your stock purchased 2 years back (at a price of Rs. 362 – as shown in the chart above), your total return will be 11% in a 2 year period. If instead you had invested in a 9% fixed income bond (or a fixed deposit), you would have made a much higher return in the same period. @9% p.a., your investment of Rs. 362 would have grown to Rs. 433 (bank compounding rate used), a total return of almost 19%.
The fact that this rule works is not because I took historic prices. On the contrary, the Coal India example I took above is a rarity. You could actually start doing this with any fundamentally sound stock and so long as you (i) stay disciplined (ii) trade in cash markets (and not in futures and options), you will make money 8 out of 10 times. The above data on Tata Motors is in fact on the basis of actual positions taken by a colleague at our office, who has managed to create a long list of what he calls ‘zero cost shares’. In January 2013, convinced that he needed to adjust the median line if he had to continue, he stopped tracking this stock and moved over to HUL.
While criticism on time value may be somewhat justified, this model can be performed on any good stock. Just to experiment, I encourage you to choose any good stock with high volatility and start buying / selling it with an imaginary fund of Rs. 1,00,000/-.
Happy stock investing!