SBI Cards & Payment Services Limited (“SBI Cards” or the “Company”) is subsidiary of SBI, offering an extensive credit card portfolio to individual cardholders and corporate clients which includes lifestyle, rewards, travel and fuel, shopping, banking partnership cards and corporate cards covering all major cardholder segments in terms of income profiles and lifestyles.
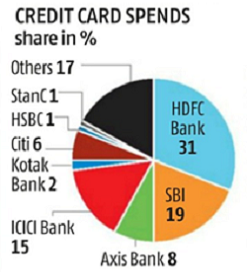
SBI Card is the second largest credit card issuer in India, after HDFC Bank, with a market share of 19.0%.
SBI Cards offer 14 different modes of payment to its credit cardholders. This includes remittances through Onlinesbi.com, ATM, SBI mobile banking and auto debit, which are available only for SBI accountholders.
SBI Card has a wide portfolio catering to both individual and corporate customers. SBI Card offers several cards under each of the following categories:
- Premium Cards • Classic Cards • Travel & Shopping Cards • Corporate cards • Banking partnership cards
Nearly half the cards are issued using distribution channels of SBI and other banks while the remaining are through its customer acquisition network across 145 Indian cities. The Company offers credit cards in partnership with the Visa, MasterCard and RuPay payment networks.
Major players operating in the country include HDFC Bank Ltd., SBI Cards, ICICI Bank Limited, Axis Bank Limited and Kotak, among others. HDFC Bank is the market leader and has maintained its market share in the number of outstanding credit cards at approximately 25%, followed by SBI Card at 19.0%, ICICI Bank at 16.0% and Axis Bank at 11.0%.
Financial Performance
| Particulars | FY17 | FY18 | FY19 | FY20 | FY21 | |||||
| Revenue (In Rs. Cr.) | 2,386.82 | 3,238.65 | 5,186.98 | 6,999.11 | 9,276.40 | |||||
| Growth | – | 35.69% | 60.16% | 34.94% | 32.54% | |||||
| Net Interest Income (In Rs. Cr.) | 1,956.50 | 2,717.07 | 4,475.47 | 5,981.90 | 7,975.47 | |||||
| Growth | – | 38.87% | 64.72% | 33.66% | 33.33% | |||||
| PBT (In Rs. Cr.) | 438.18 | 598.46 | 919.34 | 1,331.60 | 1,729.63 | |||||
| PAT (In Rs. Cr.) | 283.90 | 390.41 | 601.14 | 862.72 | 1,244.82 | |||||
| PAT Margin | 11.89% | 12.05% | 11.59% | 12.33% | 13.42% | |||||
| EPS (In Rs.) | 3.62 | 4.97 | 7.40 | 9.17 | 13.24 | |||||
| EPS Growth Rate | – | 37.29% | 48.89% | 23.96% | 44.29% | |||||
| Historic P/E (Closing Price of 31st March) | 0.00 | 0.00 | 0.00 | 0.00 | 44.75 | |||||
| CURRENT P/E | 103.77 | |||||||||
| CURRENT PE/ROE | 4.45 | |||||||||
| CURRENT P/B | 19.13 | |||||||||
| Historic P/B | – | – | – | 14.11 | 17.83 | |||||
| D/E | 5.13 | 5.66 | 4.85 | 3.81 | 3.25 | |||||
| PE/ROE | 0.00 | 0.00 | 0.00 | 0.00 | 1.92 | |||||
| EV/Sales | 0.00 | 0.00 | 0.00 | 9.06 | 12.06 | |||||
| ROE | 24.58% | 26.91% | 25.55% | 24.09% | 23.31% | |||||
Quarterly Performance
| Q4 FY 2020 | Q1 FY 2021 | Q2 FY 2021 | Q3 FY 2021 | Q4 FY 2021 | TTM | Q-o-Q % | Y-o-Y
% |
|
| Revenue (In Rs. Cr.) | 2,433.24 | 2,152.20 | 2,413.40 | 2,403.20 | 2,308.68 | 9,277.48 | -3.93% | -5.12% |
| Net Interest Income (In Rs. Cr.) | 2,098.82 | 1,877.57 | 2,149.23 | 2,142.27 | 2,065.02 | 8,234.09 | -3.61% | -1.61% |
| PAT (In Rs. Cr.) | 83.54 | 393.29 | 206.15 | 209.66 | 175.42 | 985 | -16.33% | 109.98% |
| PAT Margin | 3.43% | 18.27% | 8.54% | 8.72% | 7.60% | 10.61% | ||
| EPS (In Rs.) | 0.89 | 4.18 | 2.19 | 2.23 | 1.87 | 10.47 | -16.33% | 109.98% |
Q4 Highlights:
Business Volume
- Retail Spends Q4 FY21 at 113% vs Q4 FY20
- Corporate Spends in Q4 FY21 close to Q4 FY20
- New Accounts Q4 FY21 at 93% vs Q4 FY20.
Market share and Earnings:
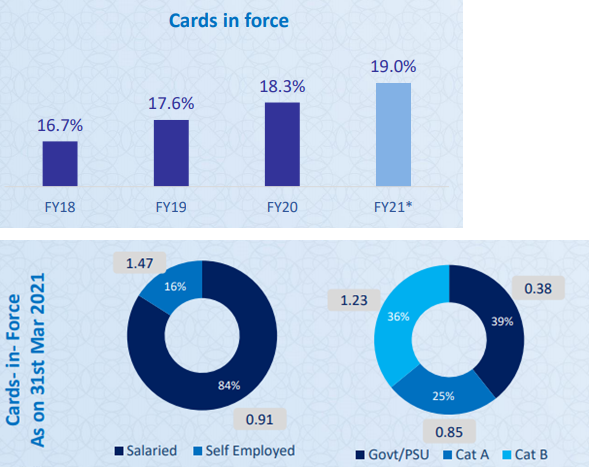
- Increase market share: Card base 78 bps (19.0% in Q4 FY21 (Feb21) Vs 18.3% in Mar20), Spends 167 bps (19.5% in FY21(YTD Feb21) vs 17.9% in FY20)
- Earnings before credit costs increased by 10% for FY21 on full year basis, marginally lower for Q4 FY21 vs Q4 FY20.
- PAT for Q4 FY21 175 Cr at 110% YoY
Continue to expand digital payment landscape and improve product suite – Launch of Aurum Card to target super affluent, an invitation only card enriched by exclusive privileges along with a personalised kit and Metallic Card.
Growing Portfolio – 12% growth in cards, 11% growth in spends, 4% growth in Receivables
Asset Quality – GNPA @ 4.99%, NNPA @ 1.15%
Adequate liquidity – Diversified borrowings mix, adequate banking limits available.
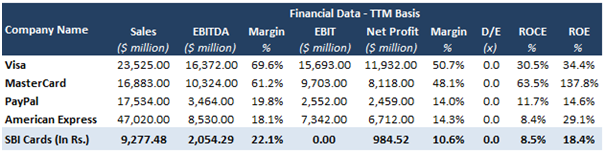
Peer Comparison – Since there are no Indian listed peer companies, we included international peers
INVESTMENT RATIONALE
- Strong Financial Position – The Company’s total revenue grew robustly at a CAGR of 44.6% from FY17-21 while its net profit grew by a CAGR of 52.1%. NIM has largely been stable at ~15.5%. The Company pays a royalty fees to SBI for using its logo. The royalty fees is 2% of net profits or 0.2% of total income, whichever is higher.
- Growth Momentum Maintained in Market Share – In Q4 FY21, 791,000 new accounts have been opened and cards-in-force reached 11,822 (2.9% QoQ). As of Feb 2021, market share improved to 19.0% (vs 18.3% in March 20). Much of the new customer acquisitions came from internal sourcing channels as the % share of Open market channels reduced to 45.6% (vs 48.1% in Q3FY21).
- Digital Wave Offering Healthy Growth Visibility – SBI Cards is set to forge ahead on a healthy growth trajectory as under penetrated market (three cards/100 population), potential within the group (existing-to-bank customers at ~49%) and increasing digital transactions (73% CAGR in FY15- 21) would lever growth. Industry spends have grown at 29% CAGR in FY13- 21. Industry growth, in terms of spends, is set to be 20%+, going ahead, with SBI Cards in a comfortable position to benefit and gain market share as well.
- Distribution Network – Operates through a diversified customer acquisition network including sales force of 32,677 outsourced personnel operating out of 145 Indian cities. The Company also has access to SBI’s network of 21,961 branches across India and their 445.5 million customers to market its products.
- Diversified Credit Card Portfolio – The portfolio includes SBI Card-branded credit cards as well as co-branded credit cards. The Company offers four primary SBI Card – branded credit cards: SimplySave, Simply Click, Prime and Elite. It is also the largest co-brand credit card issuer in India and has partnership with travel, fuel, fashion, healthcare and mobility industries like Air India, Apollo Hospitals, BPCL, Etihad Guest, FBB, IRCTC, OLA Money and Yatra, among others.
- Highly Underpenetrated Market Provides Huge Potential – As per CRISIL, Indian credit card market is highly underpenetrated at just 3% and expects it to grow at 23% CAGR over the next five years, driven by the increasing penetration in smaller cities, rising organized retail and growth in payments infrastructure. It also expects credit card spend to grow 2.5x over the next 5 years, led by focus on digitalization, developments in e-commerce, and the demographic changes.