NYKAA TOP-DOWN ANALYSIS
India is projected to become a ₹2,474 billion beauty and personal care opportunity by 2027 from ₹1506 billion in FY22
TOTAL ADDRESSABLE MARKET IN BPC FOR NYKAA
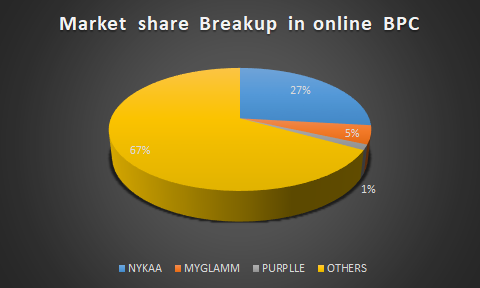
- The online BPC market is expected to grow at 29% CAGR over the next 5 years to ₹799 billion in 2027 from ₹227 billion in FY22
- Nykaa commands 2.2% market share in the overall BPC industry and 27% in the online channel as of FY22. –> Lets assume that Nykaa can hold back close to 30% market share which gives us a GMV of close to ₹240 billion alone from BPC segment
TOTAL ADDRESSABLE MARKET IN FASHION FOR NYKAA
India is projected to become ₹11,746 billion fashion opportunity by 2027
- In 2022, the online fashion sector reached a size of ₹1,189 billion based on the gross merchandise value (GMV) generated from online checkouts and is expected to reach to ₹3922 billion
- Nykaa’s share in GMV according to our estimate came close to 1.5% in overall online Fashion market and we believe that Nykaa has right set of unit metrics to take this to 3% market share which gives us a GMV of close to ₹117 billion in Fashion segment
OTHERS SEGMENT
The current Gross Merchandise Value (GMV) from the Others segment is now close to 8.35 billion. Even if we estimate a rough 50% Compound Annual Growth Rate (CAGR) on this low base, we get a Future Value (FV) of 28.18 billion, which would be roughly 7% of the overall GMV.
TOTAL EXPECTED GMV IN 2027
- BPC = ₹240 billion
- FASHION = ₹117 billion
- OTHERS = ₹28.18 billion
TOTAL = 385 Billion
Now even if they can convert at least 50% of GMV to revenue our projection comes out to be
| Particulars | FY21 | FY22 | FY23 | FY24 | FY27E |
| Revenue from operations | 2440.9 | 3773.9 | 5143.8 | 6385.6 | 19250 |
| Cost of goods sold | 1492.6 | 2130 | 2865.7 | 3646.4 | 10780 |
| Gross profit | 948.3 | 1643.9 | 2278.1 | 2739.2 | 8470 |
| EBITDA | 156.7 | 163.3 | 256 | 346.2 | 962.5 |
| Profit after tax | 61.6 | 41.3 | 24.8 | 39.7 | 433.1 |
Since Nykaa profitability is least concerned at this juncture valuing Nykaa on PE basis would be absurd so we would value Nykaa through Price to Sales ratio. Currently Nykaa is trading at a multiple of 7.52. According to our estimates of 19250 we believe a conservative forward multiple of 5 would justify Nykas’s valuations.
EXPECTED MARKET CAP FY27E
19250 * 5 = 96250CR
CURRENT MARKET CAP AS OF 04-06-2024
45079 CR
INVESTMENT RATIONALE
Nykaa has emerged as a prominent contender in India’s e-commerce industry. Through cultivating a robust online and offline presence, delivering personalized customer experiences, and offering a wide range of products, Nykaa has successfully set itself apart from competitors and established its leadership in the Indian beauty and wellness market. Beyond its business achievements, Nykaa’s triumph extends to its unwavering dedication to innovation, expanding business verticals in similar domains, and maintaining a focus on profitability.
The huge addressable and growing market in fashion and BPC segments will continue to drive revenue growth. Additionally, leveraging private labels will aid in expanding EBITDA margins.
In my opinion, while marketing strategies can be replicated, discounts offered, and channels copied by competitors, certain aspects such as customer comfort with the platform, loyalty, and trust associated with Nykaa, particularly due to its non-focus on pricing alone, along with private label offerings and exclusive tie-ups, cannot be easily disrupted.
Moreover, Nykaa’s commitment to continuous growth through expanding into similar business segments adds further resilience to its competitive position.
FINANCIAL SUMMARY (Rs in crore)
| Particulars | FY21 | FY22 | FY23 | FY24 |
| Revenue from operations | 2440.9 | 3773.9 | 5143.8 | 6385.6 |
| Cost of goods sold | 1492.6 | 2130 | 2865.7 | 3646.4 |
| Gross profit | 948.3 | 1643.9 | 2278.1 | 2739.2 |
| Employee benefit expense | 233 | 326.5 | 491.7 | 543.51 |
| Other expenses | 558.6 | 1154.2 | 1530.4 | 175.131 |
| EBITDA | 156.7 | 163.3 | 256 | 346.2 |
| Depreciation and amortization | 71.6 | 96.4 | 173.3 | 224 |
| Finance cost | 30.7 | 46.5 | 74.6 | 83 |
| Other income | 11.8 | 27 | 30.2 | 30 |
| Profit before tax | 66.1 | 47.3 | 38.4 | 69 |
| Tax expense | 4.5 | 6 | 13.6 | 29.3 |
| Profit after tax | 61.6 | 41.3 | 24.8 | 39.7 |
| Share in loss of associate | 0 | 0 | 3.9 | 0 |
| Profit for the period | 0 | 41.3 | 21 | 39.7 |
ABOUT THE COMPANY
“Established in 2012 by Falguni Nayar, Nykaa is an Indian e-commerce company that revolutionized the market for Indian women by offering beauty and wellness products online. Nykaa has swiftly emerged as one of the most sought-after online beauty platforms in India. The company provides an extensive selection of beauty products from over 6250 brands, encompassing makeup, skincare, haircare, fragrances, and more. It sells cosmetics, wellness, and fashion products through its websites, apps, and 187 physical stores in 68 cities in India.
BUSINESS MODEL OF NYKAA
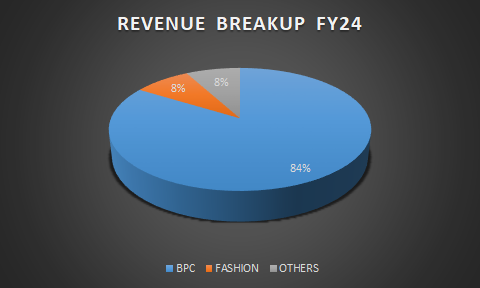
- Beauty and Personal Care (BPC) (84% of revenue)- Colour cosmetics which comprise makeup is the largest sold category in the BPC, followed by Skincare, Haircare, Personal care, Fragrances, Devices, and others-
- Nykaa operates with an inventory-driven business model for the BPC category. Nykaa purchases products directly from manufacturers and stores them in its warehouses. By doing so, Nykaa can maintain control over the quality and availability of its products. Additionally, Nykaa implements an omnichannel marketing strategy, engaging with customers through various channels such as its website, mobile app, social media platforms, offline stores, and events. This multi-channel approach enhances Nykaa’s reach and allows for greater customer engagement.
- The company has 2 segments that provide different margins:
- Private Label: This is Nykaa’s own brand. The company outsources manufacturing and takes on the marketing and distribution under its own name. The brands can be 100% Nykaa-owned or in a JV structure. The company envisions this category becoming 20% of the GMV as this gives the company the most margin.
- Inventory: The 3rd party inventory is sold through an inventory-led model a low-margin business.
- The average value of Orders in BPC was ₹1857 for the FY23 a growth of 17% YoY
BUSINESS PERFORMANCE FOR BPC
| Particulars | FY 2024 | FY 2023 |
| Monthly Average Unique Visitors (in million) | 22.7 | 22.7 |
| Annual Unique Transacting Customers (in million) | 11.7 | 10 |
| Orders (in million) | 41.7 | 34.8 |
| Average Order Value (AOV) (₹) | 1,857 | 1,857 |
| Gross Merchandise Value (GMV) (in ₹ million) | 83409 | 66,491 |
- Nyka fashion (8% of revenue) – Nykaa has brands like 20Dresses, NYKD, KICA, Gajra Gang, and several others.
- Apparel is the largest category, followed by bags & footwear, jewelry & accessories as well as lingerie, and electronics.
- It is building up its fashion business with similar principles it used to build its BPC business: (1) a strong focus on merchandising, brand assortment, and exclusivity, (2) focusing on premiumization and upselling as opposed to discount-led tactics adopted by competitors.
- The average value of Orders on Nykaa Fashion mobile application and website was ₹3973 for the FY23 a growth of 17% YoY
BUSINESS PERFORMANCE FOR FASHION
| Particulars | FY 2024 | FY 2023 |
| Monthly Average Unique Visitors (in million) | 17.3 | 17.3 |
| Annual Unique Transacting Customers (in million) | 3 | 2.5 |
| Orders (in million) | 7 | 6 |
| Average Order Value (AOV) () | 3,973 | 3,973 |
| Gross Merchandise Value (GMV) (in million) | 32699 | 25,696 |
- Others (8% of revenue)
- Nyka e-B2B – Since India BPC market may increase substantially, 41-50% consumption is expected from unorganized trade. The current distribution system, which caters to the unorganized part of the market, has a few inefficiencies such as fragmented distribution, poor credit coverage, uneven playing field (large brand dominating newer brands) etc. Nykaa plans to leverage and disrupt this via technology through its eB2B platform Superstore. Nykaa aims to buy directly from the brand, bypass middlemen (distributors/wholesalers) and directly supply to retailers.
- NykaaMan – Nykaa launched NykaaMan mobile application/website in FY21, thus customizing models and experiences for men, also spiking education/awareness among men on grooming/personal care product use.
BUSINESS PERFORMANCE FOR OTHERS
| Particulars | FY 2022 | FY 2023 |
| Monthly Average Unique Visitors (in million) | 2 | 2.7 |
| Annual Unique Transacting Customers (in million) | 0.4 | 0.5 |
| Orders (in million) | 0.6 | 1.4 |
| Average Order Value (AOV) (H) | 2,726 | 3,420 |
| Gross Merchandise Value (GMV) (in H million) | 1,727 | 5,245 |
WHAT MADE THE IDEA OF NYKAA SO POPULAR
The problem of counterfeit makeup was much larger back then. Women thought they were paying for authentic products. You’d get swarmed by hawkers selling the Maybelline Colossal Kajal counterfeit and even if you used the original product all these years, you couldn’t recognize any difference in its packaging. This was the same problem in buying things online. Amazon and Flipkart had dodgy sellers for makeup with inconsistent pricing.
Falguni Nayar, the Founder & CEO spotted challenges such as limited options in color cosmetics, a lack of convenience problems and started the company in 2012 investing a couple of million dollars of her own money.
Nykaa would buy in bulk from the makeup companies, warehouse it and when the item was sold, do the shipping and fulfillment for the order. Basically Nykaa is a platform company which is running on an inventory led model.
Nykaa’s content-to-commerce flywheel- To understand better Nykaa business model we must understand the concept of Flywheels effect.
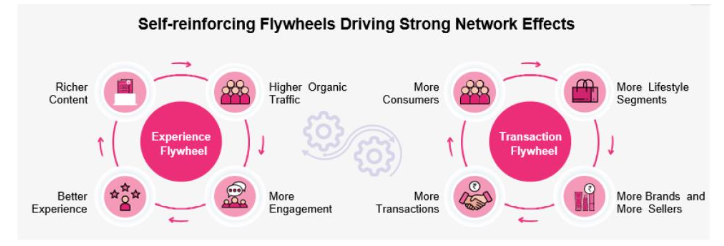
NYKAA CLAIMS TO BE A PLATFORM-DRIVEN COMPANY WHICH INTURN GIVES RISE TO THIS FLYWHEEL EFFECT.
As consumer traffic increases, so does the number of transactions on its platform. With more consumers and transactions, there is a growing imperative for more brands and sellers to associate with Nykaa, thereby expanding the choices available to consumers. The experience flywheel further accelerates the transaction flywheel: more consumer data leads to better analytics, resulting in higher engagement and a superior experience. This, in turn, fosters the creation of more content, which further enhances consumer experience and drives transactions.
Industry Analysis
- India is projected to become a ₹2,474 billion beauty and personal care opportunity by 2027
- According to RedSeer, the Beauty and Personal Care (BPC) Market in India was valued at ₹ 1,506 billion in 2022,
growing at a CAGR of 9% over the past two years. This market is projected to grow at a CAGR of 10% and reach a size of ₹ 2,474 billion in the next five years. - Online BPC in India grew at 48% CAGR between 2020 and 2022 to be ₹ 227 billion in size, contributing to ~15%
of the India BPC Market as of 2022. According to RedSeer estimates, the online BPC market is expected to grow at 29% CAGR over the next 5 years to ₹799 billion in 2027
- According to RedSeer, the Beauty and Personal Care (BPC) Market in India was valued at ₹ 1,506 billion in 2022,
- A recent report by JM Financials indicates a shift towards higher BPC spending, with 16% / 14% of consumers spending Rs. 10,000-20,000 / >20,000 respectively, compared to 8% / 6% a few years ago. The share of consumers spending < INR 2,000 has contracted from 43% to 21% now, validating the argument suggested by Nykaa that Indian per capita beauty shopping is expected to rise sharply.
- Higher skincare and haircare expenses now indicate premiumization. Also, when it’s about skin and hair, people become loyal to brands compared to when using makeup.
- Large young population driving consumption: India has the largest Generation Z and millennial population globally. According to the UN Population Division estimates for 2019, approximately 375 million Indians are Generation Z (10-24 years of age) and approximately 333 million Indians are millennials (25-39 years of age), forming approximately 51% of the Indian population. Both groups are considered India’s biggest spenders, a trend likely to increase further as they enter their prime earning and spending years.
