Somany Ceramics Limited (“Somany Ceramics” or “Company”) is the 2nd largest organised tiles manufacturer in India (in terms of revenue). The Company is engaged in manufacturing of ceramic wall & floor tiles, polished vitrified tiles, glazed vitrified tiles, sanitaryware and bath fittings.
Somany Ceramics operates through its two own manufacturing plant in Kassar, Haryana (19.63 MSM) and Kadi, Gujarat (6.65MSM) and through its six subsidiaries / associate plants located in Gujarat with a capacity of 24.25 MSM.
The Company has a pan-India presence, with a market share of about 7%. The Company possesses about 10,000 touch points including a network of 1,736 active dealers and 324 showrooms/ display centres. Somany Ceramics also exports to a number of countries in Europe, Middle East, Asia and Africa, generating about 4% of its revenue from exports.
The Company currently has installed capacity of 50.53 Million Sq. Meters (MSM) and through outsourcing model has access to 9 MSM of additional capacity. The Company also has capacity to produce 1.15 mn pcs p.a. of sanitary ware products and 0.65 mn pcs p.a. of faucet.
Note: In the last one year, Somany Ceramics share price has fallen 58%, from Rs. 855.75 to Rs. 361.75 (price as on 23rd Jan, 2019).
Falling Rupee and Rising Crude Oil has led to the sharp fall in the stock prices of almost all the tiles manufacturers. Power and Fuel cost accounts for around 20-22% of revenues for the tile companies.
In last 1 year,
- Kajaria Ceramics has fallen 25%, from Rs. 714.90 to Rs. 537.25
- Cera Sanitaryware has fallen 29%, from Rs. 3651.10 to Rs. 2569.65
- Asian Granito has fallen 75%, from 592.30 to Rs. 146.50
An increase in competition from unorganised players, rising gas price and the inability to pass on higher input costs to customers impacted the operating margin. The EBITDA margin of Somany Ceramics has declined from 11.61% in Q2 FY 2018 to 6.73% in Q2 FY 2019.
Financial Position
| Particulars | FY14 | FY15 | FY16 | FY17 | FY18 |
| Revenue (In Rs. Cr.) | 1,262.91 | 1,543.12 | 1,717.67 | 1,730.86 | 1,712.71 |
| Growth | – | 22.19% | 11.31% | 0.77% | -1.05% |
| EBITDA (In Rs. Cr.) | 81.38 | 107.56 | 142.91 | 233.67 | 185.85 |
| EBITDA Margin | 6.44% | 6.97% | 8.32% | 13.50% | 10.85% |
| EBIT (In Rs. Cr.) | 58.95 | 80.97 | 114.63 | 202.39 | 144.57 |
| EBIT Margin | 4.67% | 5.25% | 6.67% | 11.69% | 8.44% |
| PBT (In Rs. Cr.) | 43.52 | 68.10 | 101.22 | 180.59 | 122.76 |
| PAT (In Rs. Cr.) | 28.87 | 46.39 | 64.70 | 98.16 | 70.45 |
| PAT Margin | 2.29% | 3.01% | 3.77% | 5.67% | 4.11% |
| EPS (In Rs.) | 7.43 | 11.94 | 15.27 | 23.16 | 16.62 |
| EPS Growth Rate | – | 61% | 28% | 52% | -28% |
| Historic P/E (Closing Price of 31st March) | 21.78 | 33.57 | 25.60 | 29.71 | 39.94 |
| CURRENT P/E (based on price of 23rd Jan – Rs. 361.75 and EPS TTM – Rs. 13.12) | 27.57 | ||||
| Shareholder funds (In Rs. Cr.) | 223.46 | 258.01 | 428.17 | 524.17 | 580.68 |
| Minority Interest (In Rs. Cr.) | 4.44 | 5.31 | 20.01 | 83.44 | 95.91 |
| Debt (In Rs. Cr.) | 147.24 | 161.64 | 208.94 | 439.99 | 477.23 |
| Cash (In Rs. Cr.) | 34.56 | 15.37 | 18.27 | 24.03 | 13.60 |
| D/E | 0.66 | 0.63 | 0.49 | 0.84 | 0.82 |
| Interest Coverage | 4.39 | 5.24 | 6.36 | 6.00 | 4.66 |
| ROCE | 15.71% | 19.05% | 17.44% | 19.32% | 12.53% |
| ROE | 19.48% | 26.39% | 23.64% | 34.45% | 21.14% |
Quarterly Performance
| Quarterly Results | Q2 FY 2018 | Q1 FY 2019 | Q2 FY 2019 | TTM | Q-o-Q % | Y-o-Y % |
| Revenue
(In Rs. Cr.) |
442.92 | 380.72 | 393.49 | 1,712.36 | 3.35% | -11.16% |
| EBITDA
(In Rs. Cr.) |
51.41 | 31.36 | 26.49 | 120.66 | -15.53% | -48.47% |
| EBITDA Margin | 11.61% | 8.24% | 6.73% | 7.05% | ||
| PAT
(In Rs. Cr.) |
21.01 | 8.51 | 4.57 | 55.60 | -46.30% | -78.25% |
| PAT Margin | 4.74% | 2.24% | 1.16% | 3.25% | ||
| EPS | 4.96 | 2.01 | 1.08 | 13.12 | -46.27% | -78.23% |
Q2 FY 2019 Con-Call Highlights:
Q2FY19 Performance – The management highlighted that continuous credit control that is being implemented by Somany Ceramics has been the major reason for the dismal performance in Q2 FY 2019.
Other issues like Kerala floods (13% business exposure), truckers’ strike and an eight day gas pipeline maintenance at Kassar plant added to the woes. All these operational issues resulted in Rs. 35-40 Cr. revenue loss in Q2 FY 2019. Also, increase in crude prices and weakening rupee have shown a direct impact on the Company’s EBITDA margins and bottomline.
On a positive note, Somany Ceramics was able to reduce receivable days to 83 days (105 days earlier), which will make the Company structurally strong, going ahead.
Gas Prices – Average gas prices for the Company stood at Rs. 40/SCM (Standard Cubic Meter) in Q2 FY 2019 vs. Rs. 36/ SCM in Q1 FY 2019. The management expects gas prices to inch up by ~Rs. 1/SCM in Q3 FY 2019E. However, with crude prices easing hereon, it expects gas prices to go down subsequently.
Capex – The management has guided for capex of ~ Rs. 50-60 Cr. in FY 2020E
Somany vs. Kajaria Ceramics
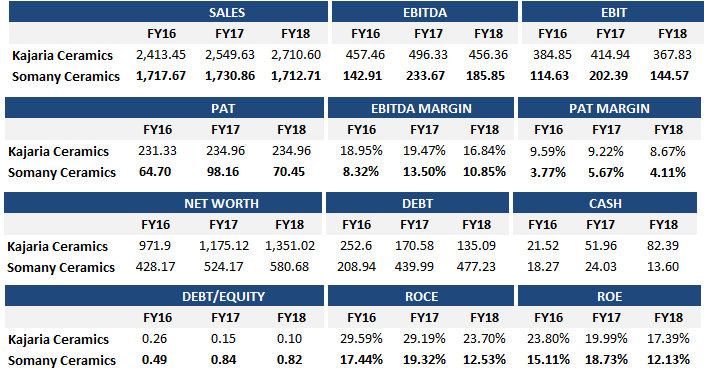
- Kajaria has consistently reported higher EBITDA margins compared to Somany over the past five years.
- Increase in power and fuel costs in FY 2018 led by higher gas prices impacted Somany by 200bps and Kajaria by 160bps. Kajaria’s PAT margin stood at 8.4% in FY18, 2x Somany’s (4.6%).
- Kajaria’s PAT margin stood at 8.7% in FY 2018, ~2x Somany’s (4.1%).
- While Kajaria’s net debt fell from Rs. 252 Cr. to Rs. 135 Cr. over FY16-18, Somany’s increased from Rs. 209 Cr. to Rs. 477 Cr.
WHAT’S DRIVING THE STOCK?
Sanitaryware, Bath Fittings Business Update
The segment revenues stood at Rs. 45 Cr. for Q2 FY 2019 and contributed 11% to the overall Company’s sales. The Company took a price hike of 5-6% for sanitaryware & faucets. Going ahead, the Company will focus in enhancing the product mix with additions of value-added products and by increasing sanitaryware and faucets sales. The management has also guided for 30-35% revenue growth in FY 2020. In addition, Somany Ceramics is doubling its faucets manufacturing capacity, which is expected to be commissioned in Q4 FY 2019E.
Capacity Expansion through its Asset Light Model
The significant advantage of expansion through the JV route over greenfield projects has made Somany Ceramics move towards an asset light model. This can be seen from the fact that the Company has expanded its JV capacity from 2.7 MSM in FY 2012 to 25.7 MSM currently. Subsequently, revenues from the JV route account for 45.0% of overall revenues. Going ahead, the Company’s strategy to grow via the JV route would improve its revenues and margins.
Price Hike Measures
The Company took price hikes across its product portfolio to the tune of 2.0-2.5% for tiles (effective October, 2018) and 5.0-6.0% for sanitaryware & faucets (effective November, 2018). With price hike, improvement in product mix and stable gas prices here on, the management expects EBITDA margins to improve to 11.1% by FY 2020E.
Gas prices (currently around Rs 40/SCM) are expected to fall in Q4 FY 2019 following the recent sharp fall in crude oil prices. All these factors are set to place it on a margin revival trajectory.
The Company exhibited robust revenue and earnings growth of 10.2% and 34.9% YoY respectively, in FY 2014-2018 led by its capacity expansion, change in product mix and by moving to high value vitrified tiles.
Reasonable Valuation – Somany Ceramics is trading at 40% discount to Kajaria Ceramics’ current valuation. The Company is also trading at 7% discount to its 5 year’s historic PE multiple.
Factors like fall in crude oil, capacity expansion are likely to improve the financial performance of the Company.
HSIL is not part peers?