[1] Bajaj Auto – Bajaj Auto Limited (“Bajaj Auto” or the “Company”) is ranked as the world’s fourth largest three and two wheeler manufacturer and the Bajaj brand is well-known across several countries in Latin America, Africa, Middle East, South and South East Asia.
In 2007, Bajaj Auto acquired a 14% stake in KTM that has since grown to 48%. This partnership catalysed Bajaj Auto’s endeavour to democratise motorcycle racing in India. Bajaj Auto today exclusively manufactures Duke range of KTM bikes and exports them worldwide.
Bajaj Auto has also led the pioneering introduction of India’s first ever Quadricycle – Qute.
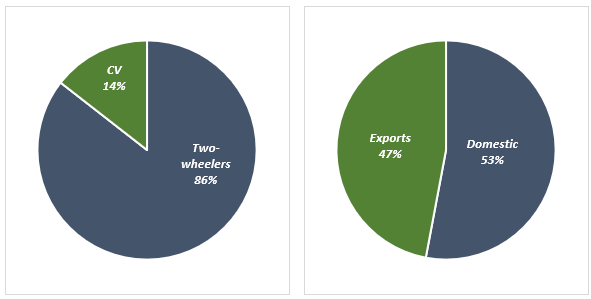
Bajaj Auto exports to 70+ countries and a significant share of revenues come from Exports.
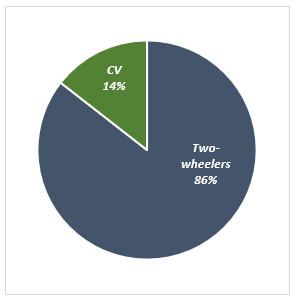
Volume – FY 2020
Financial Performance
| Particulars | FY16 | FY17 | FY18 | FY19 | FY20 | |||||
| Revenue (In Rs. Cr.) | 22,586.52 | 21,766.68 | 25,218.93 | 30,357.63 | 29,918.65 | |||||
| Growth | – | -3.63% | 15.86% | 20.38% | -1.45% | |||||
| EBITDA (In Rs. Cr.) | 4,781.08 | 4,419.39 | 4,835.65 | 5,189.51 | 5,095.64 | |||||
| EBITDA Margin | 21.17% | 20.30% | 19.17% | 17.09% | 17.03% | |||||
| EBIT (In Rs. Cr.) | 4,473.92 | 4,112.10 | 4,520.85 | 4,923.82 | 4,849.21 | |||||
| EBIT Margin | 19.81% | 18.89% | 17.93% | 16.22% | 16.21% | |||||
| PBT (In Rs. Cr.) | 5,457.45 | 5,332.93 | 5,645.80 | 6,605.83 | 6,370.62 | |||||
| PAT (In Rs. Cr.) | 4,061.24 | 4,079.49 | 4,218.95 | 4,927.61 | 5,211.91 | |||||
| PAT Margin | 17.98% | 18.74% | 16.73% | 16.23% | 17.42% | |||||
| EPS (In Rs.) | 140.36 | 140.99 | 145.81 | 170.30 | 180.13 | |||||
| EPS Growth Rate | – | 0.45% | 3.42% | 16.80% | 5.77% | |||||
| Historic P/E (Closing Price of 31st March) | 17.14 | 19.90 | 18.82 | 17.31 | 18.23 | |||||
| CURRENT P/E | 22.29 | |||||||||
| CURRENT PE/ROE | 0.93 | |||||||||
| Shareholder funds (In Rs. Cr.) | 14,020.31 | 17,856.57 | 20,425.24 | 23,233.81 | 21,662.08 | |||||
| Minority Interest (In Rs. Cr.) | 0.04 | 0.03 | 0.02 | 0.01 | 0.01 | |||||
| Debt (In Rs. Cr.) | 0.00 | 0.00 | 0.00 | 0.00 | 0.00 | |||||
| Cash (In Rs. Cr.) | 867.03 | 301.36 | 792.66 | 933.07 | 316.34 | |||||
| PE/ROE | 0.59 | 0.87 | 0.91 | 0.82 | 0.76 | |||||
| D/E | 0 | 0 | 0 | 0 | 0 | |||||
| Interest Coverage | NA | |||||||||
| ROCE | 34.10% | 24.75% | 23.67% | 22.34% | 23.52% | |||||
| ROE | 28.97% | 22.85% | 20.66% | 21.21% | 24.06% | |||||
Quarterly Performance
| Quarterly Results | Q2 FY 2020 | Q1 FY 2021 | Q2 FY 2021 | Q-o-Q % | Y-o-Y % |
| Revenue (In Rs. Cr.) | 7,707.32 | 3,079.24 | 7,155.86 | 132.39% | -7.16% |
| EBITDA (In Rs. Cr.) | 1,278.83 | 408.42 | 1,265.72 | 209.91% | -1.03% |
| EBITDA Margin | 16.59% | 13.26% | 17.69% | ||
| PAT (In Rs. Cr.) | 1,523.31 | 395.51 | 1,193.97 | 201.88% | -21.62% |
| PAT Margin | 19.76% | 12.84% | 16.69% | ||
| EPS (Rs.) | 52.65 | 13.67 | 41.26 | 201.88% | -21.62% |
Q2 FY 2021 Highlights:
- Domestic two-wheelers registered a strong turnaround in the first half of the quarter driven by pent up demand.
- Industry grew by 7% in Q2 and its growth was in line with Industry and hence the Company’s market share was 18.2% in H1 / FY21 vs 18.1% in H1 / FY20.
- KTM and Husqvarna had their highest ever sales in a quarter of 20,200 vehicles
- Export continues to perform very well, and September was the highest ever month at 2,12,000 units. Strong revival of demand was witnessed in Latin America and Africa while ASEAN continues to be weak and Sri Lanka has stopped all vehicle imports.
- Domestic CV volumes continue to remain muted. Within CV, cargo has fared better than passenger and its share has increased to 37% which is the highest ever. Overall, the Company’s market share was 53.3%.
Valuation Perspective – At the current price of Rs. 3285.70 (as on 10th December 2020), Bajaj Auto’ trailing 12 months PE comes to ~ 22.29x which is at 22% PREMIUM to its 5 years average PE Multiple of 18.28x. Based on this, fair value of Bajaj Auto comes out to be Rs. 2695.45
[2] HERO MOTOCORP LIMITED
Hero Motocorp Limited (“Hero Motocorp” or the “Company”) is the dominant market leader in India – the world’s largest two-wheeler market – with over 50% share in the domestic motorcycle market.
Hero MotoCorp currently sells its products in more than 40 countries across Asia, Africa, Middle East, and South and Central America. Hero MotoCorp has eight state-of-the-art manufacturing facilities, including six in India, and one each in Colombia and Bangladesh.
During H1 FY2021, the Company made an additional investment of Rs. 84 Crore (US$11million) in Ather Energy, taking up its shareholding in the Company to 34.58%, up from 31.27%. Hero MotoCorp has been a part of Ather’s growth story since 2016, when it first invested as a part of Series B funding.
Harley-Davidson & Hero Motocorp Announce Agreements For India Market – On 27th October 2020, the Company announced as per a distribution agreement, Hero MotoCorp will sell and service Harley-Davidson motorcycles, and sell Parts & Accessories and General Merchandise riding gear and apparel through a network of brand-exclusive Harley-Davidson dealers and Hero’s existing dealership network in India.
Financial Performance
| Particulars | FY16 | FY17 | FY18 | FY19 | FY20 | |||||
| Revenue (In Rs. Cr.) | 28,457.12 | 28,610.43 | 32,458.37 | 33,970.82 | 29,253.97 | |||||
| Growth | – | 0.54% | 13.45% | 4.66% | -13.89% | |||||
| EBITDA (In Rs. Cr.) | 4,397.70 | 4,575.97 | 5,325.05 | 5,018.43 | 4,060.92 | |||||
| EBITDA Margin | 15.45% | 15.99% | 16.41% | 14.77% | 13.88% | |||||
| EBIT (In Rs. Cr.) | 3,954.45 | 4,073.72 | 4,750.07 | 4,393.99 | 3,215.16 | |||||
| EBIT Margin | 13.90% | 14.24% | 14.63% | 12.93% | 10.99% | |||||
| PBT (In Rs. Cr.) | 4,352.67 | 4,568.39 | 5,242.44 | 5,043.54 | 4,576.45 | |||||
| PAT (In Rs. Cr.) | 3,141.98 | 3,584.27 | 3,720.40 | 3,444.09 | 3,638.11 | |||||
| PAT Margin | 11.04% | 12.53% | 11.46% | 10.14% | 12.44% | |||||
| EPS (In Rs.) | 157.30 | 179.44 | 186.25 | 172.42 | 182.13 | |||||
| EPS Growth Rate | – | 14.08% | 3.80% | -7.43% | 5.63% | |||||
| Historic P/E (Closing Price of 31st March) | 18.73 | 17.96 | 19.02 | 14.65 | 8.77 | |||||
| CURRENT P/E | 25.31 | |||||||||
| CURRENT PE/ROE | 0.80 | |||||||||
| Shareholder funds (In Rs. Cr.) | 8,834.11 | 10,315.51 | 11,971.46 | 13,120.41 | 14,406.29 | |||||
| Minority Interest (In Rs. Cr.) | 54.63 | 67.38 | 93.21 | 116.11 | 140.60 | |||||
| Debt (In Rs. Cr.) | 230.04 | 247.98 | 225.00 | 308.52 | 209.90 | |||||
| Cash (In Rs. Cr.) | 179.09 | 195.39 | 237.57 | 435.41 | 435.41 | |||||
| D/E | 0.03 | 0.02 | 0.02 | 0.02 | 0.01 | |||||
| PE/ROE | 0.38 | 0.41 | 0.43 | 0.38 | 0.28 | |||||
| Interest Coverage | 301.01 | 167.74 | 172.89 | 134.98 | 87.07 | |||||
| ROCE | 43.37% | 38.32% | 38.65% | 32.44% | 21.79% | |||||
| ROE | 49.27% | 44.29% | 43.79% | 38.44% | 31.77% | |||||
Quarterly Performance
| Quarterly Results | Q2 FY 2020 | Q1 FY 2021 | Q2 FY 2021 | Q-o-Q % | Y-o-Y % |
| Revenue (In Rs. Cr.) | 7,660.27 | 2,969.08 | 9,473.32 | 219.07% | 23.67% |
| EBITDA (In Rs. Cr.) | 1,144.27 | 117.06 | 1,308.26 | 1017.60% | 14.33% |
| EBITDA Margin | 14.94% | 3.94% | 13.81% | ||
| PAT (In Rs. Cr.) | 879.45 | 59.14 | 958.49 | 1520.71% | 8.99% |
| PAT Margin | 11.48% | 1.99% | 10.12% | ||
| EPS (Rs.) | 44.25 | 2.96 | 47.98 | 1520.95% | 8.43% |
Q2 FY 2021 Highlights:
- Volume – 18.22 Lacs units sold in Q2 FY’21 – a growth of 7.7% over the corresponding quarter in the previous fiscal
- The earnings in the second quarter of FY21 reflects a strong performance, signalling a gradual revival from the negative impact of the global pandemic
- The Company has registered significant gains in market share in Q2 across products and geographies and expect to maintain the lead through its well positioned product portfolio
Valuation Perspective – At the current price of Rs. 3198 (as on 10th December 2020), Hero MotoCorps’ trailing 12 months PE comes to ~ 25.31x which is at 50% Premium to its 5 years average PE Multiple of 16.82x. Based on this, fair value of Hero MotoCorp comes out to be Rs. 2125.
[3] TVS MOTOR COMPANY LIMITED
TVS Motor Company Limited (“TVS” or the “Company”) is the third largest 2-wheeler company in India. The Company has an annual sale of more than 3 million units and an annual capacity of over 4.95 million vehicles. TVS Motor is also the 2nd largest exporter in India with exports to over 60 Countries.
TVS Motor manufactures the largest range of 2-wheelers, starting from mopeds, to scooters, commuter motorcycles, to racing inspired bikes like the Apache series and the RR310.
The Company has four manufacturing plants, three located in India (Hosur in Tamil Nadu, Mysore in Karnataka and Nalagarh in Himachal Pradesh) and one in Indonesia at Karawang.
Financial Performance
| Particulars | FY16 | FY17 | FY18 | FY19 | FY20 | |||||
| Revenue (In Rs. Cr.) | 11,377.06 | 12,462.62 | 16,294.50 | 20,159.99 | 18,849.31 | |||||
| Growth | – | 9.54% | 30.75% | 23.72% | -6.50% | |||||
| EBITDA (In Rs. Cr.) | 816.11 | 868.76 | 1,496.70 | 2,160.82 | 2,273.05 | |||||
| EBITDA Margin | 7.17% | 6.97% | 9.19% | 10.72% | 12.06% | |||||
| EBIT (In Rs. Cr.) | 553.92 | 551.94 | 1,123.10 | 1,719.11 | 1,717.05 | |||||
| EBIT Margin | 4.87% | 4.43% | 6.89% | 8.53% | 9.11% | |||||
| PBT (In Rs. Cr.) | 575.25 | 657.76 | 930.24 | 1,081.15 | 874.01 | |||||
| PAT (In Rs. Cr.) | 429.15 | 511.24 | 652.35 | 704.67 | 624.62 | |||||
| PAT Margin | 3.77% | 4.10% | 4.00% | 3.50% | 3.31% | |||||
| EPS (In Rs.) | 9.03 | 10.76 | 13.73 | 14.83 | 13.15 | |||||
| EPS Growth Rate | – | 19.13% | 27.60% | 8.02% | -11.36% | |||||
| Historic P/E (Closing Price of 31st March) | 35.74 | 40.03 | 45.10 | 31.79 | 22.63 | |||||
| CURRENT P/E | 105.23 | |||||||||
| CURRENT PE/ROE | 5.53 | |||||||||
| Shareholder funds (In Rs. Cr.) | 1,818.48 | 2,216.04 | 2,677.20 | 3,170.17 | 3,282.10 | |||||
| Minority Interest (In Rs. Cr.) | -0.51 | 8.78 | 181.08 | 245.77 | 320.94 | |||||
| Debt (In Rs. Cr.) | 899.30 | 1,242.08 | 5,553.39 | 8,162.97 | 9,001.93 | |||||
| Cash (In Rs. Cr.) | 53.57 | 51.26 | 172.93 | 206.31 | 1,107.57 | |||||
| D/E | 0.49 | 0.56 | 2.07 | 2.57 | 2.74 | |||||
| PE/ROE | 1.51 | 1.74 | 1.85 | 1.43 | 1.19 | |||||
| Interest Coverage | 11.66 | 14.57 | 4.43 | 3.26 | 2.66 | |||||
| ROCE | 30.03% | 25.06% | 17.79% | 18.66% | 18.03% | |||||
| ROE | 23.60% | 23.07% | 24.37% | 22.23% | 19.03% | |||||
Quarterly Performance
| Quarterly Results | Q2 FY 2020 | Q1 FY 2021 | Q2 FY 2021 | Q-o-Q % | Y-o-Y % |
| Revenue (In Rs. Cr.) | 4,960.27 | 1,939.65 | 5,254.36 | 170.89% | 5.93% |
| EBITDA (In Rs. Cr.) | 577.48 | 73.56 | 633.44 | 761.12% | 9.69% |
| EBITDA Margin | 11.64% | 3.79% | 12.06% | ||
| PAT (In Rs. Cr.) | 150.61 | -179.37 | 179.93 | – | 19.47% |
| PAT Margin | 3.04% | -9.25% | 3.42% | ||
| EPS (Rs.) | 5.34 | -3.78 | 3.79 | – | -29.03% |
Q2 FY 2021 Highlights:
- In Q2 FY 2020, the Company had reported a onetime exceptional gain of Rs. 76 Cr.
- The production and sales improved consistently from July 2020 onwards. In the month of July 2020, the total two-wheeler sales was 2.44 Lakh numbers, it improved to 2.77 Lakh numbers in the month of August 2020 and in September 2020 sales further improved to 3.13 Lakh numbers.
- Total two-wheeler sales of 8.34 Lakh for the quarter was almost in line with last year second quarter number of 8.42 Lakh.
Valuation Perspective – At the current price of Rs. 498.80 (as on 10th Dec 2020), TVS’ trailing 12 month PE comes to ~ 105.23x which is at 119% PREMIUM to its 5 year average PE Multiple of 47.96x. Based on this, fair value of TVS Motor’s comes out to be Rs. 227.33
3-WHEELERS STOCKS
[1] Atul Auto Limited
Atul Auto Limited (“Atul” or the “Company”) is amongst the fastest growing 3 Wheeler Company in India, with the presence across 21 states with 200 primary and 130 secondary networks.
The Company’s dealership, sales, service, and spare parts network comprises over 600 touch points across the globe. ATUL has emerged as the only player with complete range of 3Wheeler products across the fuel range- Diesel, Petrol, CNG, LPG and Electric.
Financial Performance
| Particulars | FY16 | FY17 | FY18 | FY19 | FY20 | |||||
| Revenue (In Rs. Cr.) | 531.04 | 475.33 | 555.98 | 666.76 | 625.34 | |||||
| Growth | – | -10.49% | 16.97% | 19.93% | -6.21% | |||||
| EBITDA (In Rs. Cr.) | 76.28 | 59.50 | 72.54 | 81.48 | 71.17 | |||||
| EBITDA Margin | 14.36% | 12.52% | 13.05% | 12.22% | 11.38% | |||||
| EBIT (In Rs. Cr.) | 70.99 | 54.22 | 67.28 | 75.94 | 64.77 | |||||
| EBIT Margin | 13.37% | 11.41% | 12.10% | 11.39% | 10.36% | |||||
| PBT (In Rs. Cr.) | 71.53 | 56.10 | 69.43 | 81.95 | 66.88 | |||||
| PAT (In Rs. Cr.) | 47.40 | 36.72 | 47.89 | 55.05 | 53.60 | |||||
| PAT Margin | 8.93% | 7.73% | 8.61% | 8.26% | 8.57% | |||||
| EPS (In Rs.) | 21.60 | 16.73 | 21.82 | 25.09 | 24.43 | |||||
| EPS Growth Rate | – | -22.53% | 30.42% | 14.95% | -2.63% | |||||
| Historic P/E (Closing Price of 31st March) | 23.92 | 27.90 | 20.22 | 13.51 | 5.70 | |||||
| CURRENT P/E | 21.40 | |||||||||
| CURRENT PE/ROE | 0.99 | |||||||||
| Shareholder funds (In Rs. Cr.) | 153.61 | 183.98 | 220.82 | 261.95 | 307.82 | |||||
| Minority Interest (In Rs. Cr.) | 0.00 | 0.00 | 0.00 | 0.00 | 0.00 | |||||
| Debt (In Rs. Cr.) | 0.00 | 0.00 | 0.00 | 0.00 | 0.00 | |||||
| Cash (In Rs. Cr.) | 12.82 | 42.53 | 17.87 | 16.79 | 2.43 | |||||
| D/E | 0.00 | 0.00 | 0.00 | 0.00 | 0.00 | |||||
| PE/ROE | 0.51 | 0.92 | 0.64 | 0.43 | 0.26 | |||||
| Interest Coverage | NA | |||||||||
| ROCE | 46.21% | 29.47% | 30.47% | 28.99% | 21.04% | |||||
| ROE | 46.57% | 30.49% | 31.44% | 31.28% | 21.73% | |||||
Quarterly Performance
| Quarterly Results | Q2 FY 2020 | Q1 FY 2021 | Q2 FY 2021 | Q-o-Q % | Y-o-Y % |
| Revenue (In Rs. Cr.) | 172.18 | 26.55 | 76.47 | 188.02% | -55.59% |
| EBITDA (In Rs. Cr.) | 20.09 | -7.22 | 2.21 | – | -89.00% |
| EBITDA Margin | 11.67% | -27.19% | 2.89% | ||
| PAT (In Rs. Cr.) | 17.97 | -6.35 | 2.07 | – | -88.48% |
| PAT Margin | 10.44% | -23.92% | 2.71% | ||
| EPS (Rs.) | 8.19 | -2.89 | 0.94 | – | -88.52% |
Valuation Perspective – At the current price of Rs. 192.40 (as on 10th Dec 2020), Atul Auto’ trailing 12 month PE comes to ~ 21.40x which is at 17% PREMIUM to its 5 year average PE Multiple of 18.25x. Based on this, fair value of Atul Auto’s comes out to be Rs. 164.
[2] Scooters India Limited
Scooters India Limited (“Scooters India” or the “Company”) is a totally integrated automobile plant, engaged in designing, developing, manufacturing and marketing a broad spectrum of conventional and non-conventional fuel driven 3-wheelers.
The Company’s plant owes its origin to M/s. Innocenti of Italy from which it bought over the plant and machinery, design, documentation, copyright etc. The Company also possesses the world right of the trade name LAMBRETTA / LAMBRO.
In 1975, the Company started its commercial production of Scooters under the brand name of Vijai Super for domestic market and Lambretta for overseas market. It added one more wheel to its product range and introduced three wheelers under the brand name of VIKRAM/LAMBRO. However, in 1997, strategically, the company discontinued its two-wheeler production and concentrated only on manufacturing and marketing of 3 wheelers.
Financial Performance
| Particulars | FY16 | FY17 | FY18 | FY19 | FY20 | |||||
| Revenue (In Rs. Cr.) | 139.09 | 96.44 | 50.46 | 63.85 | 72.01 | |||||
| Growth | – | -30.66% | -47.68% | 26.54% | 12.78% | |||||
| EBITDA (In Rs. Cr.) | -0.53 | -10.59 | -22.84 | -4.85 | -15.73 | |||||
| EBITDA Margin | -0.38% | -10.98% | -45.26% | -7.60% | -21.84% | |||||
| EBIT (In Rs. Cr.) | -2.42 | -12.23 | -24.59 | -6.78 | -17.80 | |||||
| EBIT Margin | -1.74% | -12.68% | -48.73% | -10.62% | -24.72% | |||||
| PBT (In Rs. Cr.) | 5.77 | -8.79 | -18.62 | -4.63 | -15.73 | |||||
| PAT (In Rs. Cr.) | 5.48 | -9.05 | -18.62 | -4.63 | -15.73 | |||||
| PAT Margin | 3.94% | -9.38% | -36.90% | -7.25% | -21.84% | |||||
| EPS (In Rs.) | 0.63 | -1.04 | -2.13 | -0.53 | -1.80 | |||||
| EPS Growth Rate | – | – | – | – | – | |||||
| Historic P/E (Closing Price of 31st March) | 41.01 | – | – | – | – | |||||
| CURRENT P/E | – | |||||||||
| CURRENT PE/ROE | – | |||||||||
| EV/EBITDA | – | – | – | – | – | |||||
| D/E | 0.27 | 0.30 | 0.14 | 0.18 | 0.24 | |||||
| PE/ROE | – | – | – | – | – | |||||
| Interest Coverage | NA | |||||||||
| ROCE | – | – | – | – | – | |||||
| ROE | – | – | – | – | – | |||||
Quarterly Performance
| Quarterly Results | Q2 FY 2020 | Q1 FY 2021 | Q2 FY 2021 | Q-o-Q % | Y-o-Y % |
| Revenue (In Rs. Cr.) | 17.67 | 0.44 | 1.76 | 300.00% | -90.04% |
| EBITDA (In Rs. Cr.) | -3.25 | -5.53 | -5.76 | – | – |
| EBITDA Margin | – | – | – | ||
| PAT (In Rs. Cr.) | -3.41 | -5.70 | -5.81 | – | – |
| PAT Margin | – | – | – | ||
| EPS (Rs.) | -0.39 | -0.65 | -0.67 | – | – |
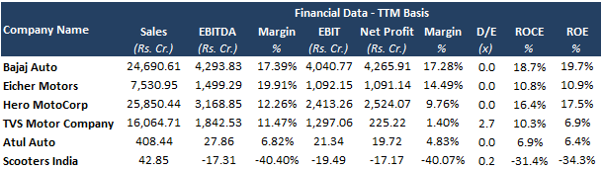
Comparative Valuation Table