Supreme Industries Limited (“Supreme Industries” or the “Company”) is India’s leading plastic processing company with 5 business divisions. The Company is one of the largest plastic processor in India, with a sale of over 4 lakh MT annually.
Current Price – Rs.1113
 Manufacturing Capacity – 25 plants situated across India with an asset base of over Rs. 2500 Cr. and one more plant envisaged along with several brown field expansion capex of about Rs. 350 -400 Cr. planned in 2018-19.
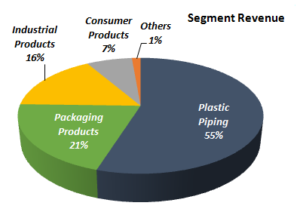
Business Verticals – Plastic Piping Division, Consumer Products (Chairs, Stools etc), Packaging Products (Specialty Films, Protective Packaging Products, Cross Laminated Film Products), Industrial Products (Industrial Components Material Handling Division, Composite Products (LPG Cylinder).
| Business Vertical | Product Portfolio | Targeted Customer Segment |
| Plastic Piping
System – 14% Market Share |
uPVC Pipes, Injection Moulded fittings, Handmade fittings, Pipes & Fittings, HDPE Pipe Systems, CPVC Pipes Systems, Inspection Chambers, Water Tanks, Septic Tanks, Toilets, DWC HDPE PIPE System, Bath Fittings, Solvents | · Potable Water Supply
· Irrigation · Sewage& Drainage · Plumbing& Sanitation · Industrial Pipe System · Fire Sprinkler System |
| Consumer Products – 11% Market Share | Furniture | · House Hold
· Office Establishments · Institutions |
| Industrial Products | Industrial Components
Material Handling Products ( Crates, Pallets, Bins & Dustbins) – 12.5% Market Share |
· Auto Sector
· Electronic Household Appliances · Water Purification – filters · Soft Drink Companies · Agriculture & Fisheries |
| Packaging
Products |
Specialty Films
Protective Packaging products Cross Laminated film products Cross Line Bonded Film Products |
· Consumer Appliances
· Food Industry · Sports Goods · Insulation · Construction · Automobiles · Mattresses and so on. |
| Composite Products | LPG Cylinders | · Retail / Household |
Financial Position
| Particulars | FY14 | FY15 | FY16 | FY17 | FY18 | ||||||
| Revenue (In Rs. Cr.) | 3,962.23 | 4,255.19 | 2,960.06 | 4,462.26 | 4,966.29 | ||||||
| Growth | – | 7.39% | -30.44% | 50.75% | 11.30% | ||||||
| EBITDA (In Rs. Cr.) | 588.81 | 666.24 | 460.98 | 761.87 | 787.11 | ||||||
| EBITDA Margin | 14.86% | 15.66% | 15.57% | 17.07% | 15.85% | ||||||
| EBIT (In Rs. Cr.) | 487.26 | 527.25 | 356.41 | 607.58 | 619.96 | ||||||
| EBIT Margin | 12.30% | 12.39% | 12.04% | 13.62% | 12.48% | ||||||
| PBT (In Rs. Cr.) | 414.33 | 471.72 | 329.67 | 582.45 | 602.79 | ||||||
| PAT (In Rs. Cr.) | 283.44 | 322.36 | 221.38 | 430.40 | 431.75 | ||||||
| PAT Margin | 7.15% | 7.58% | 7.48% | 9.65% | 8.69% | ||||||
| EPS (In Rs.) | 22.31 | 25.38 | 17.43 | 33.88 | 33.99 | ||||||
| EPS Growth Rate | – | 14% | -31% | 94% | 0.3% | ||||||
| Historic P/E (Closing Price of 31st March) | 22.51 | 28.08 | 42.44 | 32.25 | 35.13 | ||||||
| CURRENT P/E (based on price of 18th December – Rs. 1113.00) | 26.87 | ||||||||||
| Shareholder funds (In Rs. Cr.) | 1,039.16 | 1,211.50 | 1,315.72 | 1,695.72 | 1,894.90 | ||||||
| Minority Interest (In Rs. Cr.) | 0.00 | 0.00 | 0.00 | 0.00 | 0.00 | ||||||
| Debt (In Rs. Cr.) | 384.57 | 328.80 | 227.98 | 231.54 | 232.36 | ||||||
| Cash (In Rs. Cr.) | 24.63 | 181.83 | 28.87 | 79.83 | 36.30 | ||||||
| RATIOS | |||||||||||
| D/E | 0.37 | 0.27 | 0.17 | 0.14 | 0.12 | ||||||
| Interest Coverage | 7.73 | 11.49 | 15.96 | 25.18 | 35.91 | ||||||
| ROCE | 34.22% | 34.23% | 23.09% | 31.53% | 29.14% | ||||||
| ROE | 39.87% | 38.94% | 25.06% | 34.35% | 31.81% | ||||||
| Quarterly Results | Q2 FY 2018 | Q1 FY 2019 | Q2 FY 2019 | TTM | Q-o-Q % | Y-o-Y % |
| Revenue (In Rs. Cr.) | 1,055.06 | 1,345.71 | 1,316.17 | 5,411.44 | -2.20% | 24.75% |
| EBITDA (In Rs. Cr.) | 143.95 | 185.69 | 212.46 | 882.64 | 14.42% | 47.59% |
| EBITDA Margin | 13.64% | 13.80% | 16.14% | |||
| PAT (In Rs. Cr.) | 70.81 | 136.35 | 107.28 | 526.16 | -21.32% | 51.50% |
| PAT Margin | 6.71% | 10.13% | 8.15% | |||
| EPS (In Rs.) | 5.57 | 10.73 | 8.45 | 41.42 | -21.25% | 51.71% |
Q2 FY 2018 – Highlights
- Top-line growth was driven by ~5% yoy growth in volumes and on account of higher pricing.
- The increase in revenue was led by 20% yoy growth in Plastic Piping products and 37% yoy growth in Industrial Products. Consumer Products grew by 10.2% yoy. Packaging products declined by 3.5% yoy.
- Lower other expenses and employee expenses aided EBITDA margin expansion.
- The new plant to manufacture Industrial Components at Giloth (Rajasthan) has commenced commercial production during September, 2018.
- Declared interim dividend for FY 2019 @ 200% i.e. Rs. 4 per share
WHAT’S DRIVING THE STOCK?
Leadership Position
Supreme Industries holds leadership position in the organized domestic plastic piping market and is the second largest player in moulded plastic furniture. Further, it has a strong presence across other segments of plastics like packaging products and industrial products. Over the last 10 years, the Company posted 14.6 % revenue CAGR and 22% PAT CAGR.
Diversified Product Value
Its portfolio includes plastic piping systems, storage and material handling products, molded furniture, XF films and products (agriculture, industrial), performance films (industrials), protective packaging products, composite plastic products, and petrochemicals. Apart from piping products used in the housing segment, Supreme Industries produces automobile parts, crates/boxes for material handling, furniture (tables/chairs), doors/panels for refrigerators, and packaging for edible and hydrogenated oils.
The key trigger is diversification into value-added sales streams (adhesives, packaging, consumer products, CPVC pipes etc.) which command premium valuations over pure-play PVC pipes.
Recent Fall in Crude Oil Price
With the crude price again falling down and rupee becoming stronger compared to dollar, the raw material prices for plastics (polymer) have again come to a very affordable level.
Management Commentary
Management maintained inherent demand drivers are intact: Booming affordable housing, rising farm incomes, shift from unorganized to organized. Given wide product range with continuous new product additions, expansive distribution network, pan-India manufacturing, and higher exports share, Supreme is poised to achieve 12-15% value growth target without compromising on return ratios.
Capacity Expansion
The Company plans to increase its number of plants to 28 from existing 25 by FY 2020. The Company intends to increase its capacity to 700,000 MT by FY 2021 at a capex of around Rs 1,200-1,300 Cr.
Enforcement of Lead-Free Plastic Pipes in India
Supreme Industries seems well positioned to meet the regulatory challenge of lead-free plastic pipes in India. The management said 20% of its manufactured pipes are lead free and the same can be scaled to 100% within a year once the government enforces the same.
Shift from unorganized to organized players post GST regime.
WHAT’S DRAGGING THE STOCK?
Intense Competition
The industry is highly fragmented and numerous unorganized players account for 44% of the industry. Given the competitive environment in the industry at the moment, the management has revised its full-year volume guidance downwards to around 10% (from 12-15 % at the start of the year).
Volatility in crude prices
Major raw materials consumed by the Company are poly vinyl chloride (PVC), polyethylene (PE) and polypropylene (PP), which are linked to crude prices. Supreme Industries imports 50% of raw materials. Thus, a sharp increase in crude prices could hurt the EBITDA margin of the Company.
Demand Slowdown in the sectors like real estate, agriculture.
Hi,
I want to avail yourstock advisory services.
Thanx
Toton Ghosh
M 09954175744