About the Company
 TCS Limited (“TCS” or the “Company”) is the leading global IT services, consulting and business solutions organization.
The Company provides offers a consulting-led, integrated portfolio of business, technology and engineering services and solutions. A part of the Tata group, India’s largest multinational business group, TCS has over 436,000 trained consultants in 46 countries.
TCS has filed the most number of patents (4,596) till date, compared to peers. A majority of its patents are in big data and analytics, followed by machine learning and intelligent computing. The Company has also been adding patents for the iON platform (Cloud Based Solutions for Small and Medium Businesses).
Financial Performance
| Particulars | FY15 | FY16 | FY17 | FY18 | FY19 |
| Revenue (In Rs. Cr.) | 94,648.41 | 108,646.00 | 117,966.00 | 123,104.00 | 146,463.00 |
| Growth | – | 14.79% | 8.58% | 4.36% | 18.98% |
| EBITDA (In Rs. Cr.) | 24,481.71 | 30,677.00 | 32,311.00 | 32,516.00 | 39,506.00 |
| EBITDA Margin | 25.87% | 28.24% | 27.39% | 26.41% | 26.97% |
| EBIT (In Rs. Cr.) | 22,683.02 | 28,789.00 | 30,324.00 | 30,502.00 | 37,450.00 |
| EBIT Margin | 23.97% | 26.50% | 25.71% | 24.78% | 25.57% |
| PBT (In Rs. Cr.) | 26,298.49 | 31,840.00 | 34,513.00 | 34,092.00 | 41,563.00 |
| PAT (In Rs. Cr.) | 19,852.18 | 24,270.00 | 26,289.00 | 25,826.00 | 31,472.00 |
| PAT Margin | 20.97% | 22.34% | 22.29% | 20.98% | 21.49% |
| EPS (In Rs.) | 52.91 | 64.68 | 70.06 | 68.83 | 83.87 |
| EPS Growth Rate | – | 22% | 8% | -2% | 21.9% |
| Historic P/E (Closing Price of 31st March) | 24.14 | 19.48 | 17.36 | 20.70 | 23.85 |
| CURRENT P/E (based on price of 22nd July – Rs.2098.55) | 25.02 | ||||
| EV/Sales | 4.77 | 4.14 | 3.80 | 6.04 | 5.27 |
| D/E | 0.01 | 0.00 | 0.00 | 0.00 | 0.00 |
| Interest Coverage | NA | ||||
| ROCE | 43.57% | 40.20% | 34.91% | 35.56% | 41.64% |
| ROE | 39.21% | 34.15% | 30.49% | 30.34% | 35.19% |
Quarterly Performance
| Quarterly Results | Q1 FY 2019 | Q4 FY 2019 | Q1 FY 2020 | Q-o-Q % | Y-o-Y % |
| Revenue (In Rs. Cr.) | 34,261 | 38,010 | 38,172 | 0.43% | 11.42% |
| EBITDA (In Rs. Cr.) | 9,071 | 10,074 | 10,037 | -0.37% | 10.65% |
| EBITDA Margin | 26.48% | 26.50% | 26.29% | ||
| EBIT (In Rs. Cr.) | 8,578 | 9,537 | 9,220 | -3.32% | 7.48% |
| PAT (In Rs. Cr.) | 7,340 | 8,126 | 8,131 | 0.06% | 10.78% |
| PAT Margin | 21.42% | 21.38% | 21.30% | ||
| EPS (Rs.) | 19.17 | 21.65 | 21.67 | 0.09% | 13.04% |
Q4 and FY 2019 Highlights:
- TCS reported a weaker-than-expected performance this quarter in terms of revenue growth.
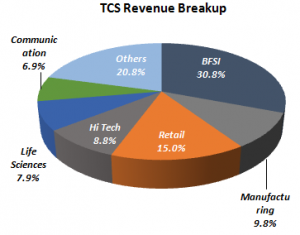
- Business Verticals:
- BFSI – grew 1.3% QoQ in the quarter. Regarding the future outlook of the sector, the management commentary largely remain unchanged with softness in capital markets and European banks
- Retail & communication segments – Retail grew at a slow 1% QoQ while communication growth was healthy at 3.1% QoQ.
- Digital Business – Digital revenue continue to accelerate with now contributing 32.2% to revenues (vs. 25% in Q1FY19)
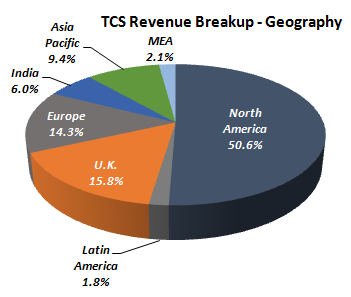
- Geographical Growth – Geographically, the growth was led by the UK (+16 %), India (+15.9 %) and Europe (+15 %). Other markets also showed good momentum: North America (+7.7 %), Asia Pacific (+9.5 %), MEA (+6.4 %) and Latin America (+6.4 %).
- Declared an interim dividend of Rs 5 per equity share
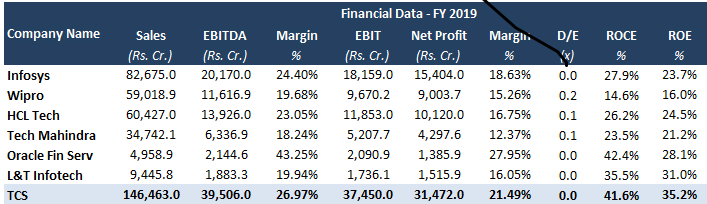
Peer Comparison
WHAT’S DRIVING THE STOCK?
Comprehensive Portfolio of Services
The Company provides a comprehensive range of IT services globally. The Company serves clients across diverse industries, including finance and banking, insurance, telecommunication, transportation, retail, manufacturing, pharmaceutical, and utilities.
Digital –Primary Growth Driver
Digital was the primary driver of growth in the quarter with a 5.6% q-o-q growth in sequential terms. Digital revenue share in overall pie continues to rise now forming 32.2% to revenues (vs. 25% in Q1FY19). With digital moving towards core modernization, TCS would be the biggest beneficiary taking into account its strength in traditional areas and acceleration in digital growth.
Strong Deal Pipeline
The Company added four customers in the $100 million or more categories in the April-June quarter. The Company’s focus on artificial intelligence helped it bag major deals across the globe.
- TCS was selected by a large European bank as a strategic partner for operating model transformation across application development, application management, and infrastructure services.
- The Company was engaged by a major U.S. airline as a strategic partner for a multi-year engagement to provide application management & quality assurance services.
- TCS has also been engaged by a major Australian telecommunications company to deliver greater efficiency by using a TCS-built digital twin, supported by cognitive and AI-enabled automation interventions.
- TCS has also been selected by a large airline group in South America to transform customer experience on its omnichannel digital commerce platforms, with TCS Interactive design, implementation and maintenance services.
Strong Parentage of Tata Group.
WHAT’S DRAGGING THE STOCK?
Q1 FY20 Weaker Performance
TCS reported a weaker-than-expected performance this quarter in terms of revenue growth. The lower-than-expected dollar revenue was due to weakness in the European banking & retail segment. In terms of EBIT margins, the Company reported a decline of 93 bps q-o-q mainly due to wage hikes and higher subcontracting cost.
The growth in banking & financial services tapered mainly due to weakness in capital markets and European banks. This trend is expected to continue, which will be a key dragger for revenue growth in the near term. In addition, 8.1% q-o-q dip in deal TCV (Total Contract Value) at US$5.7 billion does not augur well for the revenue growth trajectory.
On the Geographical front, the North America region remains a key business area and a major contributor to the revenue, it contributed around 50.6% of the total revenue. North America showed a marginal growth of 1.4% on q-o-q basis. UK region posted a flattish growth of 1% on q-o-q basis.
Intense Competition
Weaker Macroeconomic Factors like fear of recession, Brexit and Visa issues from the North America region may impact IT spending from clients in the forthcoming quarters.
Hi Rajat ,
Thank you for sharing valuable information through your blogs. Its really informative and eye opener the away you explain thing in your blogs. I have learned a lot only going through each topic you have covered in blogs. Really Appropriate your work towards knowledge sharing with others. Keep up the good work.
Regards
Chandra