Tech Mahindra Limited (“TechM” or the “Company”) operates mainly in two sectors – Telecom business and Enterprise Solutions business.
 Telecom business provides:
(1) consulting-led integrated portfolio services to telecom equipment manufacturers and telecom service providers;
(2) IT infrastructure services, business process outsourcing as well as enterprise services to various industries such as banking, financial services and insurance (BFSI), retail & logistics, manufacturing, healthcare and life sciences.
Enterprise solutions business provides IT enabled services, application development & maintenance, consulting & enterprise business solutions, engineering solutions and infrastructure management services to customers operating in diverse industries including BFSI, manufacturing, telecommunications and transportation.
Factors below have been considered to present an equity stock analysis of Tech Mahindra Limited. For a financial report: visit here – Tech Mahindra Limited.
| Current Price (BSE) (26 May, 2015) | Rs 630.00 |
| Market capitalization (26 May, 2015) | Rs 61,999.71 Cr |
| Face Value | Rs 5 |
| EPS (TTM) | Rs 117.79 |
| P/E | 5.58 times |
| No of Shares | 960788912 |
| BSE 52 week High | Rs 749.50 |
| BSE 52 week Low | Rs 444.25 |
WHAT’S DRIVING THE STOCK
Strong Financial Position | 5th Largest IT Company
Tech Mahindra has shown consistent growth over the past eight (8) financial quarters. Its net revenue from operations over the period FY2013 Q4 – FY2015 Q4 grew at an impressive CAGR of 25.28 %. For FY 2015, net revenue from operations increased by 20.13 % to Rs. 22,621.27 Cr. from Rs. 18,831.38 Cr. The Company had reserves in excess of Rs. 11,768.24 Cr. as of March 31, 2015.
Financial Performance
| Particulars (in Rs. Cr.) | 2015 | 2014 | 2013 | 2012 |
| Income from operations | 22,621.27 | 18,831.38 | 6,873.08 | 5,489.69 |
| OPBDIT | 4,152.86 | 4,183.74 | 1,424.24 | 919.40 |
| PAT | 2,627.67 | 3,028.81 | 1,287.81 | 1,095.45 |
| EPS | 26.74 | 25.36 | 19.34 | 17.61 |
| Equity Share Capital | 480.39 | 233.50 | 128.10 | 126.00 |
| Total Shareholders’ funds | 12,248.63 | 9,182.00 | 5,425.60 | 4,050.90 |
| Total Debt | 45.96 | 19.00 | 300.00 | 600.00 |
| OPBDIT / Operating Income (In %) | 18.36 | 22.22 | 20.72 | 16.75 |
| PAT/Operating Income (In %) | 11.75 | 16.26 | 11.80 | 19.95 |
| Return on capital employed (In %) | 33.34 | 44.77 | 24.41 | 16.53 |
| Return on Shareholders’ funds (In %) | 21.45 | 32.99 | 23.74 | 27.04 |
| OPBDIT/Interest & Finance Charges | 139.17 | 52.38 | 13.82 | 8.96 |
| Current Ratio | 2.73 | 2.31 | 1.14 | 1.34 |
Inorganic Growth Gaining Momentum
The Company has made some strategic acquisitions over the past few years, which have enabled TechM to expand its services and addressable market for future growth. Large deal wins and inorganic initiatives have played an important role in scaling the business. The Company has been able to increase its presence in other segment like healthcare and retail due to active acquisitions in recent past. This has helped the Company to decrease it’s over exposure to telecom sector.
Tech Mahindra is aggressively looking at acquisitions to increase its market share which will help the Company to increase its revenue in the coming years. Besides venturing into new verticals, Tech Mahindra is also looking to sell some of its businesses which are not profitable with a view to improve operating margins.
| Active on the Acquisition Front | |
| Standalone TechM | Year of Acquisition |
| Mahndra Satyam | Apr-09 |
| Hutchison Global Services | Sep-12 |
| Comviva | Sep-12 |
| Complex IT | Feb-13 |
| Combined Entity | |
| Mahindra Engineering Services | Nov-13 |
| BASF Business Service Consulting | Feb-14 |
| Fix Stream | Apr-14 |
| Lightbridge Communication Corp. | Nov-14 |
| Sofgen holdings Ltd | Jan-15 |
Merger with Satyam | Strong Balance Sheet
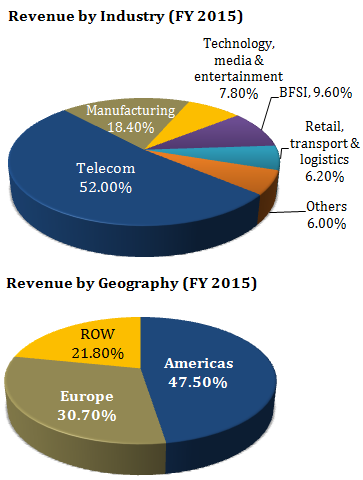
One of the most important events was the merger of Tech Mahindra Limited and Satyam Computer Services Limited. Post the merger, the Company became one of the top 5 IT service providers in India. The merger helped significantly increase the scale of operations of the Company and diversify its revenues base. Before the merger, Tech Mahindra was primarily a telecom-focused firm. Today, it has access to diverse verticals such as financial services, retail, logistics and transport, health care, and life sciences.
This has helped the Company in strengthening its balance sheet and cash flows. For FY 2015, revenue of the the merged entity stood at Rs. 22,621.27 Cr., EBITDA at Rs. 4,152.86 Cr., and Profit after Tax at Rs. 2,627.67 Cr. while the net cash in merged entity was Rs. 2,404.86 Cr. as of March 31, 2015.
Tech Mahindra’s manufacturing expertise as a result of the Satyam acquisition and strength in ERP is likely to boost growth going forward. For TechM, Manufacturing segment has seen strong client and large deal wins over the last few quarters which drives confidence on sustenance of strong growth going forward.
WHAT’S DRAGGING THE STOCK
Intense Competition
IT services industry is highly competitive globally and is facing significant competition from smaller Indian IT companies. The table below lists the top 10 Indian IT Companies (by revenue FY 2014):
| Company Name | Market Capitalization(In Rs. Cr.) | CMP (Rs.)(26 May 2015) |
| Tata Consultancy Services | 5,12,785.19 | 2,590.00 |
| Infosys | 2,32,226.85 | 2,015.05 |
| Wipro | 1,38,286.39 | 557.10 |
| HCL Technologies | 1,39,987.13 | 991.00 |
| Tech Mahindra | 62,009.95 | 630.00 |
| MphasiS | 7,973.83 | 377.00 |
| MindTree | 11,863.09 | 1,404.45 |
| KPIT Technologies | 2,070.37 | 104.50 |
| Hexaware Technologies | 8,372.29 | 276.45 |
| Zensar Technologies | 3,295.04 | 725.00 |
Also see: Market Performance of IT Companies
Mid cap IT companies are eating up the market share of large IT players due to certain competitive advantages such as:
- Cost effectiveness;
- Niche service capabilities;
- Focused client servicing approach;
- Ability to cater to clients of any size as opposed to large IT companies who only target large orders to justify costs;
From a valuations perspective also, mid-cap companies in India offer the best investment value. Companies such as Infosys, TCS, HCL Technologies and Wipro are trading at a price-to-earnings (P/E) ratio of 15-22, while mid-cap companies such as NIIT Technologies, Mindtree and Hexaware are trading at 7-11 times P/E multiple.
High concentration in Telecom Sector
TechM has high concentration towards the telecom industry. For FY2015, telecom industry has high revenue contribution share of 52% to Tech Mahindra’s total business. This is much higher compared to leading Indian and global IT peers of TechM (according to Company’s Annual Report).
There is strong need for the Company to de-risk its business which has become even more important as telecom companies continue to reduce their expenditure in in particular to effectively .compete with mid cap and smallerplayers.
________________________
** The stock analysis of Tech Mahindra Limited including the financial report linked above, is for informational purpose only. This analysis should not be taken as a buy/sell recommendation. The circumstances of the company and the economic environment may have changed since the date of this stock analysis. For an updated list of the large cap companies stocks, visit here.