Broad Trends in IT Industry for 2015:
Globally corporations are increasingly turning to offshore service providers to meet their demand for higher quality and cost competitive technology solutions.
With its contribution to the country’s exports, foreign exchange earnings and employment generation, the Indian IT industry is one of the most significant growth drivers for the Indian economy. Future growth in the sector will be fueled by growing demand from global corporations for new services such as digital technology, mobile applications and cloud computing.
India Advantage – India is widely recognized as the premier destination for the offshore technology services due to cost competitiveness in providing IT services. As per National Association of Software and Services Companies (NASSCOM), revenue of the Indian IT and Business Process Management (BPM) industry was U.S. $119 billion up by 12 % for the year 2014-15 over the previous year. The Indian IT sector is export driven with exports contributing ~80% to the total industry revenue. Out of this U.S. $119 billion, exports stood at U.S. $98 billion, up by 12.3 % over the previous year.
IT industry’s share in total Indian exports increased from 4% in FY 1998 to about 12.6% in FY 2014.
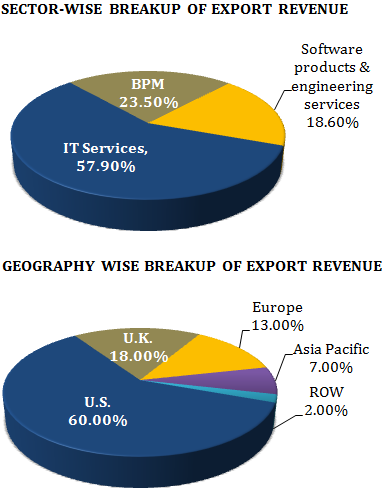 In terms of markets, the U.S. and the U.K. remain key markets for Indian IT / BPM exports (excluding hardware), accounting for nearly 80% of the total global market.
NASSCOM has estimated Indian IT-BPM service export revenues to grow to U.S. $110-112 billion in FY 2016, a growth of 12-14 % over FY 2015. Domestic revenue for the same period is expected to grow at a rate of 15-17 % and expected to reach U.S. $55-57 billion.
Quick Facts about Indian IT Sector
-
- Contribution to GDP– 9.5%
- Largest private sector employer – 3.5 million people employed
- Share of total Indian exports – > 38%
- Entrepreneurship (4th largest startup hub in the world) – 3,100 + registered IT companies in India
- Investments (PE/VC) – 53 % of total PE/ VC funds in India (approximately U.S. $6 billion) went to Indian IT sector for FY 2014-15.
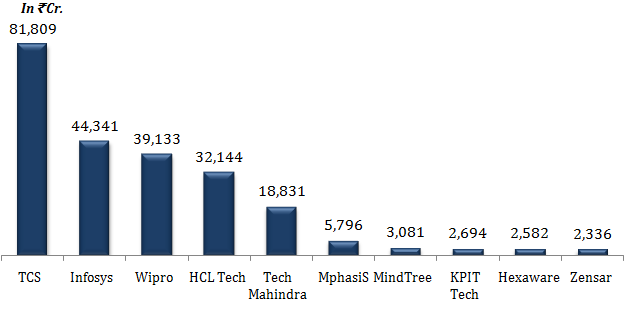
Top 10 Listed IT Companies by Revenue (FY 2014)
Financial Performance of Large IT Companies
| Particulars (in Rs. Cr.) | TCS | Infosys | Wipro | HCL Tech | TechM |
| Income from operations | 81,809 | 44,341 | 39,133 | 32,143 | 18,831 |
| OPBDIT | 25,152 | 12,527 | 9,484 | 8,035 | 4,183 |
| PAT | 19,163 | 10,194 | 7,387 | 6,509 | 3,028 |
| EPS | 97.67 | 178.39 | 30.09 | 91.93 | 126.78 |
| Equity Share Capital | 195.87 | 286.00 | 493.00 | 139.37 | 233.50 |
| Total Shareholders’ funds | 49,194 | 44,530 | 32,128 | 13,163 | 9,182 |
| Total Debt | 127.26 | – | 1,090 | 796.73 | 19.00 |
| Operating Profit Margin (In %) | 30.75 | 28.25 | 24.24 | 25.00 | 22.22 |
| Net Profit Margin (In %) | 23.63 | 22.99 | 18.88 | 20.25 | 16.26 |
| ROCE (In %) | 50.28 | 28.13 | 28.43 | 40.74 | 44.77 |
| ROE (In %) | 38.96 | 22.89 | 22.99 | 30.69 | 32.99 |
| Interest Coverage Ratio | 652.98 | – | 25.31 | 70.18 | 52.38 |
| Current Ratio | 2.74 | 2.94 | 2.22 | 1.69 | 2.31 |
Financial Performance of Mid Cap IT Companies
| Particulars (in Rs. Cr.) | Mphasis | Mindtree | KPIT Tech | Hexaware | Zensar |
| Income from operations | 5,796 | 3,081 | 2,694 | 2,581 | 2,336 |
| OPBDIT | 1,032 | 659 | 422 | 477 | 388 |
| PAT | 743 | 450 | 248 | 320 | 237 |
| EPS | 35.35 | 108.13 | 13.42 | 10.60 | 54.27 |
| Equity Share Capital | 210.13 | 41.70 | 37.10 | 59.98 | 43.77 |
| Total Shareholders’ funds | 4,934.46 | 1,640.50 | 1,275.12 | 1,199.25 | 945.50 |
| Total Debt | 498.19 | 2.70 | 438.98 | – | 95.97 |
| Operating Profit Margin (In %) | 17.81 | 20.12 | 14.01 | 18.50 | 15.56 |
| Net Profit Margin (In %) | 12.83 | 14.63 | 9.12 | 12.40 | 10.05 |
| ROCE (In %) | 19.01 | 35.21 | 20.80 | 42.71 | 33.61 |
| ROE (In %) | 15.07 | 27.47 | 19.54 | 31.61 | 25.12 |
| Interest Coverage Ratio | 31.25 | 1,446.75 | 13.84 | 530.62 | 34.07 |
| Current Ratio | 2.02 | 2.57 | 1.09 | 1.93 | 1.88 |
Mid Cap IT Companies Gaining Edge over Larger IT Companies
Some of the mid cap IT companies such as Mindtree, NIIT Technologies, Hexaware and Persistent Systems appear more attractive than the larger IT companies (TCS, Infosys, Wipro) given the challenges faced by the large cap IT companies. While the larger companies can offer end-to end services, the mid cap companies are quicker in adapting to the changing environment. Mid cap IT companies have certain advantages such as:
- Cost effectiveness;
- Niche service capabilities;
- Focused client servicing approach;
- Ability to cater to clients of any size whereas large IT companies target large orders and compete with global players.
Returns Generated by Some of the Mid Cap IT Stocks Over the Last 1 Year
| Company Name | Price on 13 April 2014 | Price on 13 April 2015 | % Change |
| Ramco System | 172.13 | 695 | 303.76 |
| Tata Elxsi | 546.3 | 1,323.20 | 142.21 |
| Rolta | 77.05 | 178.2 | 131.28 |
| Mastek | 201.05 | 456.1 | 126.86 |
| Mindtree | 688.5 | 1,483.65 | 115.49 |
| Zensar Tech | 364.2 | 750.1 | 105.96 |
| Hexaware Tech | 170.35 | 332.1 | 94.95 |
| Geometric | 111.4 | 191.65 | 72.04 |
| Cyient | 320 | 510.45 | 59.52 |
| Persistent | 526.48 | 779.65 | 48.09 |
From a valuations perspective also, mid-cap IT companies in India offer the best investment value. At current valuations, mid-cap IT stocks look quite attractive; most of these stocks are available at a discount to their large-cap peers. Companies such as Infosys, TCS, HCL Technologies and Wipro are trading at a price-to-earnings (P/E) ratio of 15-22, while mid-cap companies such as NIIT Technologies, Mindtree and Hexaware are trading at 7-11 times P/E multiple.