With banking stocks making a comeback, I got a lot of queries on potential investment opportunities in this space. Let me know in comments section below if you agree with me on this:
For a well diversified equity portfolio, you should own financial services stocks with a weight-age of at least 30% (in the current market scenario). This is in line with the weight-age of financial services stocks in the Nifty 50 which stands at ~ 31%. See here.
The article below examines 5 banking stocks hand-picked based on key performance metrics.
Note: Use of the word ‘Top’ is not based on market capitalization or profitability, if at all it indicates my personal bias.
[1] CAGR of Top 5 Banking Stocks
| Bank Stocks | 2005* | 2015* | 10 Yr CAGR (%) | 10 Yr Price Chg (%) |
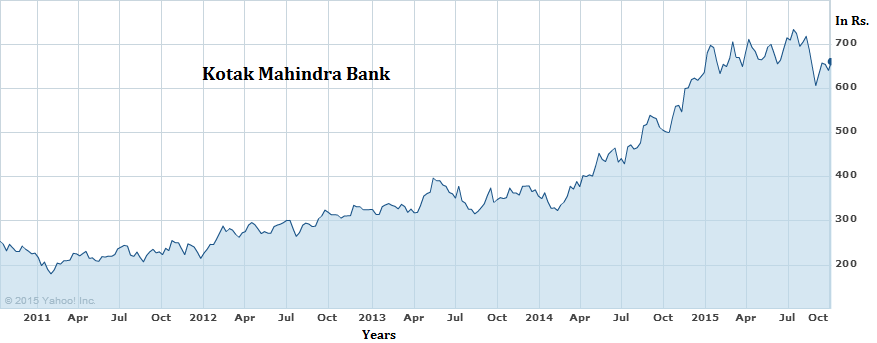
| Kotak | 42.10 | 655.30 | 73.15% | 1,457% |
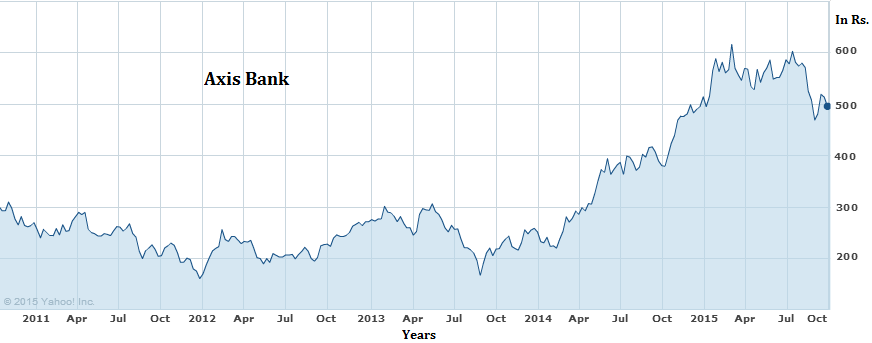
| Axis | 47.43 | 510.30 | 60.83% | 976% |
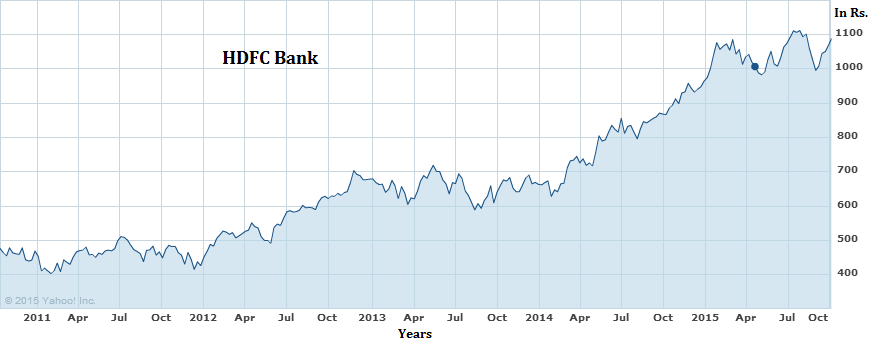
| HDFC | 128.76 | 1099 | 53.55% | 754% |
| Federal | 12.99 | 65.95 | 38.40% | 408% |
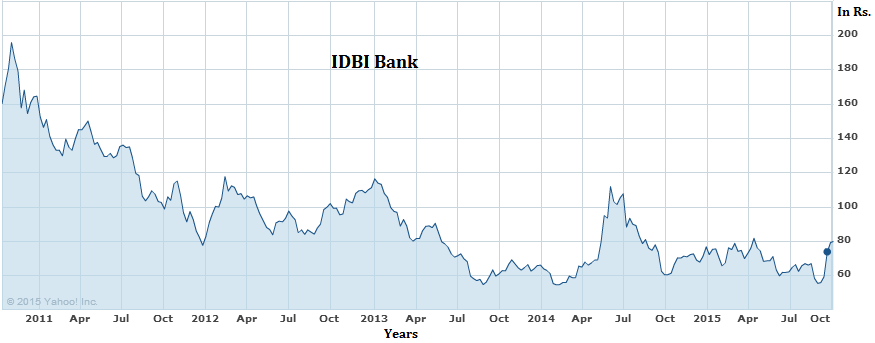
| IDBI | 96.25 | 85.50 | (2.34%) | (11%) |
- 2005 & 2010 prices as of 20th October for each year.
% Change in Stock Price
| Bank Stocks | 2010* | 2015* | 5 Yr CAGR (%) | 5 Yr Price Chg (%) |
| Kotak | 250.35 | 655.30 | 21.22% | 162% |
| Axis | 291.13 | 510.30 | 11.88% | 75% |
| HDFC | 467.40 | 1099 | 18.65% | 135% |
| Federal | 45.56 | 65.95 | 7.68% | 45% |
| IDBI | 166.20 | 85.50 | (12.45%) | (49%) |
[2] Industry-Wise Distribution of Credit Exposures For Each Bank
Credit exposure include term loans, working capital facilities (i.e. funded facilities like cash credit, demand loans, temporary limits and non-funded facilities like letter of credits, acceptances and guarantees).
| Industry | Axis | HDFC | Kotak | Federal | IDBI |
| Agriculture | – | 8% | – | – | – |
| Banking and Finance | 9% | 7% | – | – | 5% |
| Infrastructure | 7% | 4% | 6% | 22% | 15% |
| – Roads and ports | 2% | 3% | 0.4% | 11% | 6% |
| – Telecommunications | 2% | 1% | 3% | 0.1% | 4% |
| Power Generation & Distribution | 5% | 3% | 2% | 16% | 10% |
| Engineering | 4% | 3% | 4% | 7% | 2% |
| Chemicals | 3% | 2% | 4% | 8% | 2% |
| – Petro Chemicals | 1% | – | – | 3% | – |
| – Drugs and Pharma | 1% | 1% | 2% | 2% | – |
| Commercial Real Estate | 3% | 2% | – | – | 7% |
| Iron and Steel | 3% | 2% | 3% | 10% | 6% |
| Metal | 2% | 1% | – | 3% | 1% |
| Textiles | 1% | 2% | – | 8% | 3% |
| Construction | 1% | 2% | 6% | 1% | 3% |
| Petroleum Products | 1% | 3% | – | 3% | 6% |
| NBFCs | 1% | 5% | 3% | – | 3% |
| Cement and Cement Products | 1% | 1% | – | 2% | 2% |
| Mining and Quarrying | 1% | 1% | – | 1% | – |
| Automobile | 1% | 4% | 4% | 1% | – |
| Beverage and Tobacco | 0.3% | 3% | – | 0.3% | – |
| Other Industries | 58% | 47% | 19% | 16% | 35% |
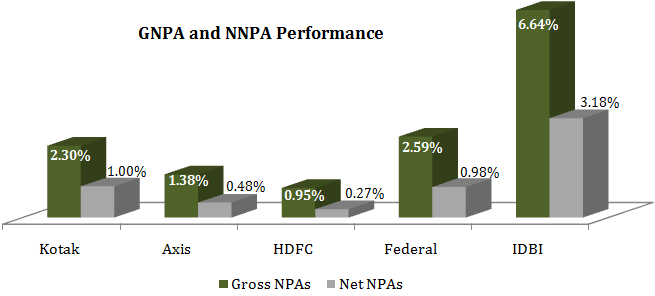
[3] NPA and GNPA
| Banks | Gross NPAs (%) | Net NPAs (%) | ||
| June 2015 | June 2014 | June 2015 | June 2014 | |
| Kotak | 2.30 | 1.90 | 1.0 | 1.0 |
| Axis | 1.38 | 1.34 | 0.48 | 0.44 |
| HDFC | 0.95 | 1.07 | 0.27 | 0.32 |
| Federal | 2.59 | 2.22 | 0.98 | 0.68 |
| IDBI | 6.64 | 5.88 | 3.18 | 2.88 |
[4] Current P/E over 5 Year P/E
- Kotak Mahindra Bank
| 2011 | 2012 | 2013 | 2014 | 2015 | |
| Price | 187.27 | 271.23 | 325.7 | 389 | 656.58 |
| EPS | 10.8 | 12.3 | 14.7 | 16.1 | 19.7 |
| P/E | 17.34 | 21.99 | 22.21 | 24.21 | 33.33 |
| Average 5 Year P/E = 23.81 | |||||
At the current price of Rs. 655.30 (price for – 20 October 2015), Kotak Bank’s trailing 12 month PE comes to ~ 41.75 which is a 75% premium to its 5 year average PE Multiple of 23.81.
Axis Bank
| 2011 | 2012 | 2013 | 2014 | 2015 | |
| Price | 280.73 | 229.18 | 260.25 | 292.09 | 560.4 |
| EPS | 16.09 | 20.33 | 24.02 | 26.84 | 31.23 |
| P/E | 17.45 | 11.27 | 10.83 | 10.88 | 17.94 |
| Average 5 Year P/E = 13.68 | |||||
At the current price of Rs. 510.30 (price for – 20 October 2015), Axis Bank’s trailing 12 month PE comes to ~ 15.81 which is a 15% premium to its 5 year average PE Multiple of 13.68.
HDFC Bank
| 2011 | 2012 | 2013 | 2014 | 2015 | |
| Price | 468.59 | 520.05 | 624.1 | 748.85 | 1022.85 |
| EPS | 17.3 | 22.2 | 28.8 | 36.3 | 43.6 |
| P/E | 27.09 | 23.43 | 21.67 | 20.63 | 23.46 |
| Average 5 Year P/E = 23.25 | |||||
At the current price of Rs. 1099.00 (price for – 20 October 2015), HDFC Bank’s trailing 12 month PE comes to ~ 25.95 which is a 11% premium to its 5 year average PE Multiple of 23.25.
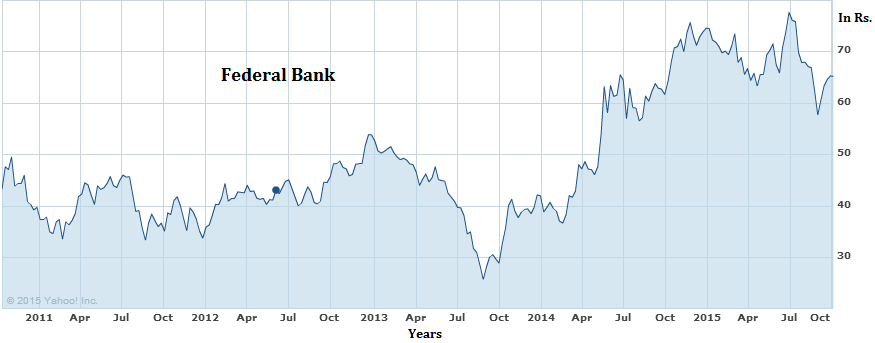
Federal Bank
| 2011 | 2012 | 2013 | 2014 | 2015 | |
| Price | 41.89 | 42.6 | 48.06 | 47.75 | 66 |
| EPS | 3.26 | 4.41 | 4.99 | 4.97 | 6.18 |
| P/E | 12.87 | 9.67 | 9.64 | 9.62 | 10.69 |
| Average 5 Year P/E = 10.50 | |||||
At the current price of Rs. 65.95 (price for – 20 October 2015), Federal Bank’s trailing 12 month PE comes to ~ 12.11 which is a 15% premium to its 5 year average PE Multiple of 10.50.
IDBI Bank
| 2011 | 2012 | 2013 | 2014 | 2015 | |
| Price | 142.45 | 104.7 | 80.25 | 65.45 | 71.05 |
| EPS | 17.4 | 20.29 | 14.81 | 8.22 | 5.87 |
| P/E | 8.19 | 5.16 | 5.42 | 7.96 | 12.10 |
| Average 5 Year P/E = 7.77 | |||||
At the current price of Rs. 85.50 (price for – 20 October 2015), IDBI Bank’s trailing 12 month PE comes to ~ 15.17 which is a 95% premium to its 5 year average PE Multiple of 7.77.
Most banking stocks are trading at a premium over their historic PE ratios. Primarily this is because over the past 5 years, stocks were trading low on account of slowdown in the economy and slow growth in earnings. Put differently, the current price earnings multiples are highlighting a positive outlook for the next few years.
FAIR VALUE CALCULATION
The historic 5 year avg of the PE multiple can be used to calculate a fair price for the stock. How this works:
Price/earnings = PE
PRICE/[Trailing 4 quarters EPS] = Historic 5 Year avg. PE
PRICE = Historic 5 Year avg. PE * Trailing 4 quarters EPS
The PRICE you will get this way, will be the fair value of the stock. You can then calculate whether the stock is trading at a premium or a discount over its historic PE.
All this is premised on the assumption that the Price of a stock moves in accordance with its earnings. So as the earnings grow, so does the price; over a longer term, the PE Ratio should remain consistent unless where major changes take place in the business model itself.
See here for an actual calculation of fair value on this basis.
[5] Revenue Break-up
Finally, in terms of revenue streams, some banks get a higher share of revenue from non funded streams.Non-funded revenue (i.e. other income) largely constitutes of fee income such as commission and brokerage fees and client based merchant foreign exchange trade, service charges from account maintenance, transaction banking (including cash management services), syndication and placement fees, processing fees from loans and commission on non-funded products (such as letters of credit and bank guarantees) etc. Growth in other income or non-funded revenue is good for the bottom line (i.e. net profit) as income from this stream is derived without significant mobilization of deposits and hence the cost associated with this income is relatively low compared to interest income. Banks in developed countries derive nearly 50% of their income from these non-funded sources.
| Bank Stocks | Fee Based Income |
| Kotak | 22.60% |
| Axis | 18.79% |
| HDFC | 14.92% |
| Federal | 9.20% |
| IDBI | 8.12% |
At the same time, banks with high Current Accounts & Savings Accounts (CASA) will contiue to earn high net interest margins as interest rate paid on CASA deposits is much lower compared to other deposits like term deposits or recurring deposits. While banks do not pay any interest on current account, interest paid on savings account deposit is set by RBI at 4%. Banks therefore make maximum effort to increase the share of CASA on their books to reduce their overall cost of deposits and increase their Net Interest Margin (NIM). HDFC Bank and Axis Bank have the advantage of a high CASA.
While high CASA is factored in stock prices at all times, going forward, I am of the view that banks with strong non-funded streams will outperform which is why Axis Bank and Kotak Mahindra remain my favorite picks within the banking space.
Sir,
May i know the reasons why SBI and ICICI wont figure in your recommendation. With government taking few steps to integrate PSU bank sector and also all its NPA’s have already been discounted already. Request you to throw some light.
Regards,
Akash
In my view the NPA problem for PSU banks is here to stay. There is hardly any accountability in loan disbursements, look for my other articles on where most banks have their exposures. PSUs (for some strange reason) are still way more exposed to infra, power and other struggling sectors than their peers.
Also look at the tier 1 capital for these banks here – http://194.195.112.90/psu-bank-stocks-and-basel-iii-capitalization-concerns/ , which means they will struggle in implementation of Basel III and will have far lesser capital to do business with.
Thank you
Hi Rajat,
Thanks.
Why is ICICI bank and Yes Bank not included in your recommendations?
And what is your opinion about DCB bank, which is at a very attractive price at present?
ICICI – Purely on account of bad sectoral exposure.
DCB – I am not sure if they have the capacity to double the branch network as they are planning. Which raises questions about why such a desire?
Hi Rajat.
We have to appreciate that by assets under control ICICI is bigger than HDFC. So it ultimately have to bet in some of high risky assets,notably Jaypee. So this is quite natural to be incorrect in your betting as you find it difficult to grow your already big asset size.Further, if you see the latest remedies adopted by ICICI by enforcing some strategic sales as well as strategic takeover I think icici is poised to improve its asset quality..on a separate note can you pl suggest me how to check the average tenure of the assets(advances) in banks bàlancesheet.
Hi Rajat.
So you don’t recommend DCB Bank even at current price, which is about 30% discount from last week’s price?
Thanks again and warm regards,
Rohi
Thanks for the detailed writeup. I would probably replace federal/idbi with indusind – better nii,npa,consistent delivery, balanced sectoral exposure and valuation. Thoughts?
Sir,
The pressure on Axis and ICICI due to NPA is clear the way investors responded after the sale to ARC. Now i understand better why you stayed away from recommending ICICI.
Now that Axis has disclosed its 1850 crore sale to ARC, would you still recommend it or do you wish to change your opinion.
Regards,
Akash
Hi Rajat,
Very good article. As another poster has asked, I too would love to hear your opinion on whether Axis Bank’s disclosure its 1850 crore sale to ARC changes your opinion of Axis being one of your favourite picks in the space?
My opinion: It looks like they are cleaning up the balance sheet, and the recent fall in the price increases the margin of safety for investors who want to get in now and participate in the long-term benefits of Axis Bank’s retail franchise. This appears like a good time for long-term investors to enter as I do not believe that the 1850cr bad assets sale to ARC alters the long-term value proposition of Axis. However, as stated above, would appreciate your opinion as well. Thanks!
Gaurav
Absolutely Gaurav. After what you have said, I have nothing more to add actually.