Indian Pharmaceutical Market
The Indian Pharmaceutical Market (IPM) accounts for approx.1.5% of the global pharmaceutical industry in value terms and 20% in volume terms. In last ten years, India’s domestic pharma market has grown to Rs 1.1 trillion from Rs. 363 billion in 2008 on the back of around 97,240 brand launches, and exports led by the U.S. market. Barring past 18-24 months, Indian Pharma stocks have made great wealth for investors over the last decade.
Mergers and acquisitions (M&A) have played an important role in the evolution of India’s pharmaceutical market. It is expected that M&A activity will continue to intensify going forward as players seek inorganic options to support growth, diversify revenue streams, boost manufacturing/R&D capabilities and achieve economies of scale.
Key M&A Deals Executed By Indian Pharmaceutical Companies in the Last 10 Years
| Date | Acquirer | Target | Deal Value
(U.S. $ million) |
| Nov-17 | Torrent Pharma | Unichem portfolio | 557 |
| Jan-17 | Piramal | Mallinckrodt’s pain portfolio | 273 |
| Jan-17 | Cadila | Sentynl Therapeutics | 171 |
| Oct-16 | Intas | Teva (UK, Ireland) | 764 |
| Jun-16 | Dr Reddy’s | Teva (8 ANDAs) | 350 |
| Sep-15 | Cipla | InvaGen | 550 |
| Jul-15 | Lupin | GAVIS | 880 |
| May-15 | Strides Shasun | Aspen (Australia) | 300 |
| Nov-14 | Aurobindo | Natrol | 133 |
| Sep-14 | Strides Arcolab | Shasun | 323 |
| Apr-14 | Sun Pharma | Ranbaxy | 3,968 |
| Dec-13 | Torrent Pharma | Elder portfolio | 323 |
| Aug-11 | Sanofi India | Universal Medicare | 114 |
| Sep-10 | Sun Pharma | Taro | 273 |
| May-10 | Abbott | Piramal | 3,720 |
| Apr-08 | Jubilant | Draxis | 255 |
| Feb-06 | Dr Reddy’s | Betapharm | 571 |
Source: JM Financial|Sector Update Indian Pharma | 22 March, 2018
Performance of Top 10 Indian Pharmaceutical Stocks – over last 2 and 3 Years (in INR)
| Name | Market Cap. (Rs. Cr.) | Price on 1 Apr 2016 (Rs.) | Price on 1 Apr 2017 (Rs.) | Change % (Apr 16-Apr 17) | Price on 1 Apr 2018 (Rs.) | Change % (Apr 17-Apr 18) |
| Sun Pharma | 153,544.78 | 800.55 | 692.90 | -13% | 507.8 | -27% |
| Cipla | 52,294.80 | 513.45 | 588.90 | 15% | 576.4 | -2% |
| Lupin | 40,408.27 | 1,465.40 | 1,452.90 | -1% | 775.4 | -47% |
| Aurobindo Pharma | 40,251.85 | 730.60 | 669.75 | -8% | 592.9 | -11% |
| Cadila Health | 39,710.98 | 320.75 | 448.60 | 40% | 384.7 | -14% |
| Dr Reddys Labs | 39,517.60 | 2,979.95 | 2,736.15 | -8% | 2132.35 | -22% |
| Biocon | 36,315.00 | 163.63 | 366.38 | 124% | 598.15 | 63% |
| Divis Labs | 34,533.48 | 1,008.70 | 632.35 | -37% | 1090.35 | 72% |
| Torrent Pharma | 29,955.18 | 1362.45 | 1,477.30 | 8% | 1263.15 | -14% |
| GSK Pharma | 28,691.45 | 3,812.70 | 2,738.40 | -28% | 2094.45 | -24% |
Major Issues Faced by Indian Pharmaceutical Market
[1] U.S. Regulatory Concern
The U.S. continues to be an important market for Indian Pharmaceutical companies, with a sizeable amount of revenue coming from the region.
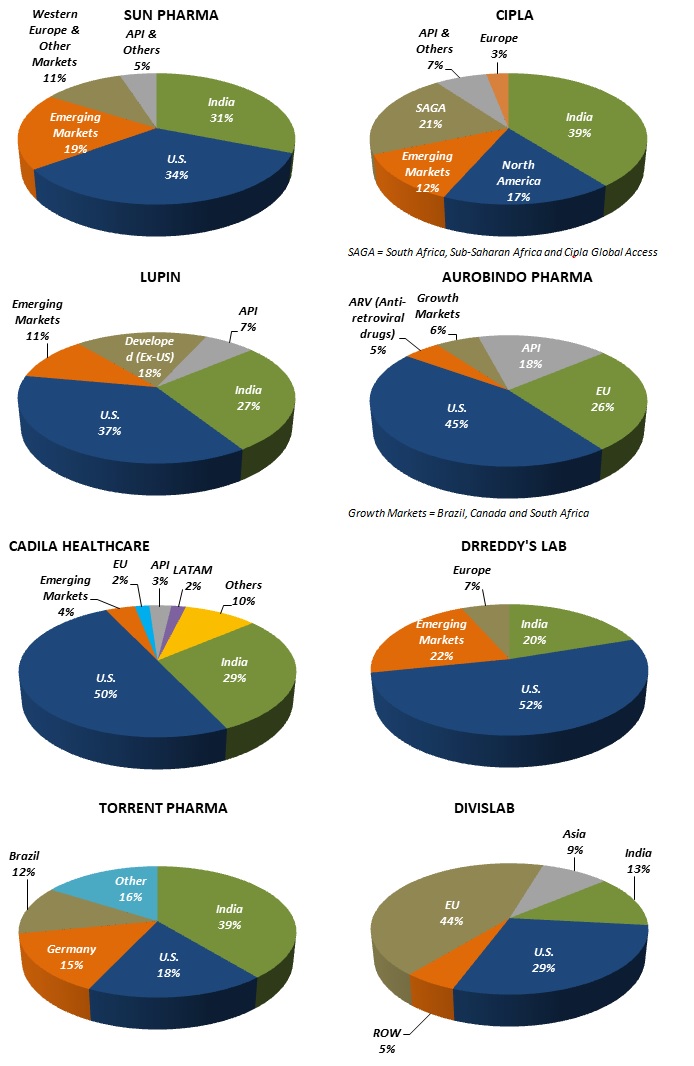
Indian Pharmaceutical Companies U.S Exposure – Sun Pharma (34%), Cipla (17%), Lupin (37%), Aurobindo (45%), Cadila Healthcare (50%) and Dr Reddy (52%).
In the last few years, the US Food and Drug Administration (USFDA) has raised red flag during its inspections on select Indian manufacturing facilities. This has impacted exports to the U.S. (where Indian pharma companies have much exposure) and product approvals. Other factors like increasing competition, new ANDA (abbreviated new drug approvals), consolidation of channel partners, price erosion are other major reasons behind the downfall of the Indian pharmaceutical companies.
TOP 10 INDIAN PHARMA STOCKS – GEOGRAPHICAL EXPOSURE
[2] Domestic Concerns
- Price Control – In the domestic market, price control initiatives have led to slowdown in sales growth over the last 2-3 years. In April 2016, the National List of Essential Medicines (NLEM) brought 18% of the Indian pharma market (by value) under price control.
- Ban of Fixed Dose Combinations – Health Ministry is again looking to ban 343 Fixed Dose Combinations (FDCs) (FDC contains two or more active pharmaceutical ingredients in a fixed dosage ratio). In 2016, the health ministry had banned 349 FDCs, including Saridon, Corex, D Cold Total and Vicks Action 500 Extra, claiming their usage is unsafe.
- Limited New Product Launches – In 2018, 3150 pharma product brands were launched as compared to 3150 in 2011.
- Government Intervention on Mandating Generic Prescription – In order to make health care affordable, the government is looking to make it mandatory for doctors to prescribe generic drugs rather than specific brand in their prescriptions. The price of generic medicines sold at Governement stores are 50 to 90% less as compared to branded medicines in open market.
Is there Any Sign of Revival for Indian Pharma Stocks?
Over the last 3-4 months, Indian pharmaceutical stocks are making a remarkable recovery after facing several regulatory challenges. Depreciating rupee is expected to play positively on pharmaceutical companies as they generate majority of their revenue from exports.
Performance of Top 10 Indian Pharmaceutical Stocks – in last 3-4 Months
| Name | Market Cap. (Rs. Cr.) | Price on 30 April 2018 (Rs.) | Price on 30 Aug 2018 (Rs.) | 3 Months Change % |
| Sun Pharma | 153,544.78 | 507.8 | 639.95 | 26% |
| Cipla | 52,294.80 | 576.4 | 649.45 | 13% |
| Lupin | 40,408.27 | 775.4 | 893.65 | 15% |
| Aurobindo Pharma | 40,251.85 | 592.9 | 687 | 16% |
| Cadila Health | 39,710.98 | 384.7 | 387.9 | 1% |
| Dr Reddys Labs | 39,517.60 | 2132.35 | 2,380.15 | 12% |
| Biocon | 36,315.00 | 598.15 | 605.25 | 1% |
| Divis Labs | 34,533.48 | 1090.35 | 1,300.85 | 19% |
| Torrent Pharma | 29,955.18 | 1263.15 | 1,770.15 | 40% |
| GSK Pharma | 28,691.45 | 2094.45 | 3,387.30 | 62% |
5 Undervalued Pharma Stocks to Buy Right Now
[1] Sun Pharma – Sun Pharmaceutical Industries Limitedis world’s fifth largest specialty generic pharmaceutical company and India’s top pharmaceutical company with 8.5% market share in the Indian pharmaceutical market. Sun Pharma’s global presence is supported by 41 manufacturing facilities across India, the Americas, Asia, Africa, Australia and Europe. With more than 2,000 products, the Company has its presence in more than 150 countries across branded and generic markets.
Segments – Specialty products, branded generics, complex generics, pure generics & APIs.
Leadership position in India | Well-established Presence in the U.S. Generics Market | Diversified Footprint
Indian formulations business contributed 32% to total revenue in FY 2018 (26% in FY 2017).
Sun Pharma also has a well established presence in the U.S. generics market, wherein it ranks fifth in terms of generic sales. The Company has a wide basket of 544 ANDAs & 42 NDAs filed and 418 ANDAs & 37 NDAs approved across multiple therapies.
The Company has been expanding its presence in the fast growing emerging and rest of world (RoW) markets as well. Sun Pharma has thus witnessed a YoY growth of 7% and 21% in the emerging markets revenues and RoW markets revenues, respectively, in FY 2018.
| SUN PHARMA | 5 YEAR AVERAGE P/E = 49.75 | ||||
| 2014 | 2015 | 2016 | 2017 | 2018 | |
| Price | 573.35 | 1022.25 | 819.45 | 687.7 | 495.4 |
| EPS | 15 | 19 | 19.6 | 29 | 9 |
| P/E | 38.22 | 53.80 | 41.81 | 23.71 | 55.04 |
| Current P/E | |||||
| Price | 661.2 | ||||
| EPS (TTM) | 15.25 | ||||
| P/E | 43.36 | ||||
[2] Lupin – Lupin Limited produces a wide range of quality affordable generic and branded formulations and Active Pharmaceutical Ingredients (APIs). The Company was formerly known as Lupin Chemicals Ltd. and changed its name to Lupin Limited in 2001 as a result of its amalgamation with Lupin Laboratories Ltd.
The Company is amongst 8th largest generic companies globally and 3rd largest Indian Pharma company by sales globally.
67% of Lupin’s business comes from International Markets. Lupin’s global formulations business constitutes close to 84% of it’s overall business mix, and in terms of geographies, USA is its largest market outside India. The Company operates a globally integrated network of 11 manufacturing facilities spread across India and Japan.
Lupin’s U.S. business performance was encouraging as revenues grew 5% QoQ to U.S. $224 million in Q4FY18. It was largely led by new product approvals during last two quarters and strong flu season in U.S.
Lupin launched 23 products in FY18 with record 11 launches in Q4 FY18
Growth in Indian Market
The domestic market exhibits a more stable demand trend. Lupin’s Indian business has grown at 11% CAGR from 2013 to 2017.
It was primarily driven by increasing market share of the over-the-counter (OTC) products, which do not need prescriptions and new product launches. Key events of FY 2018: Softovac OTC gained market share amongst bulk laxatives; Launched Corcal OTC brand.
| LUPIN | 5 YEAR AVERAGE P/E = 49.75 | ||||
| 2014 | 2015 | 2016 | 2017 | 2018 | |
| Price | 935.9 | 2007.05 | 1480.25 | 1444.8 | 736.4 |
| EPS | 41 | 53 | 50.15 | 56.46 | 5.54 |
| P/E | 22.83 | 37.87 | 29.52 | 25.59 | 132.92 |
| Current P/E | |||||
| Price | 906 | ||||
| EPS (TTM) | 2.13 | ||||
| P/E | 425.35 | ||||
[3] Cipla Limited – Cipla Limited has a full range of therapeutic offerings ranging from simple anti-infectives to complex oncology products. Cipla’s business model focuses on having partnerships with local companies across the globe.
The company has partnership deals with ~22 partners in the US and ~65 in Europe.
Exports constitute ~59% of Cipla’s sales. The Company exports both APIs and formulations to more than 170 countries.
Strong Domestic Formulation Market
Cipla is the third largest player in the domestic formulations market with approx. 4% market share. The acute, chronic and sub-chronic revenues for the Company are at 36%, 59% and 5%, respectively. Domestic formulations contribute ~38% to FY 2018 revenues.
New Product Launches
In Q1 FY 2019, Cipla launched cancer biologic drugs Bevacizumab, Trastuzumab and Rituximab in partnership with Roche. The Company also partnered with Eli Lilly to market and distributes insulin glargine injection (Basaglar) in India.
U.S. Business – Product Filings
Cipla currently markets 52 products in the U.S. 13 products are ranked No.1 and it is among the top three companies for 29 products in the U.S market.
Cipla has filed 253 ANDAs with US FDA of which 152 are approved, 25 tentatively approved and 76 ANDAs pending approvals. In Q1 FY 2019, the Company’s management indicated filing of over 20 ANDAs during FY19.
| CIPLA | 5 YEAR AVERAGE P/E = 35.16 | ||||
| 2014 | 2015 | 2016 | 2017 | 2018 | |
| Price | 383.7 | 711.2 | 512.2 | 592.3 | 543.25 |
| EPS | 17 | 15 | 18.69 | 12.5 | 17.5 |
| P/E | 22.57 | 47.41 | 27.41 | 47.38 | 31.04 |
| Current P/E | |||||
| Price | 639.4 | ||||
| EPS (TTM) | 18.04 | ||||
| P/E | 35.44 | ||||
[4] Cadila Healthcare
Cadila Healthcare is a leading pharma company in India with a market share of 4.2%.
Cadila has well diversified business across geographies; Presence in generics, branded generics, animal health and consumer wellness. Cadila operates through 32 manufacturing facilities across India, U.S. and Brazil.
US Formulations Business – 50% to total Revenue
The Company is #9 generics player in U.S. (based on prescriptions) with a market share of 3.05%. As of June 2018, Cadila’s product pipeline consists of 330 filed ANDAs, 144 pending final approvals. In FY 2017, Capila acquired U.S. based specialty pharmaceutical company, Sentynl Therapeutics Inc. to pave its way in speciality pain management segment.
Management has guided for 50+ product launches in the U.S. in FY 2019.
Indian Formulations Growth | New Product Launches
Cadila’s domestic formulation grew at a CAGR of 8% in FY 2013-2018 on the back of new product launches. In FY 2018, Cadila had 64 new product launches.
Inorganic Growth – In order to strengthen its presence in India, the Company has always tried to acquire brands of other pharma companies.
- In December 2016, Cadila acquired six brands from MSD Pharmaceuticals India
- In January 2017, 8 anti-infective and women’s health related brands from AstraZeneca.
- In August 2018, the Company acquired 51% stake in Windlas Healthcare. This acquisition will help the Company in developing a competitive product pipeline by using Windlas Healthcare’s cost-efficient manufacturing infrastructure and technical competence.
| CADILA HEALTHCARE | 5 YEAR AVERAGE P/E = 16.90 | ||||
| 2014 | 2015 | 2016 | 2017 | 2018 | |
| Price | 205.28 | 347.86 | 316.95 | 443.25 | 378.65 |
| EPS | 39 | 56 | 14.87 | 14.82 | 17.35 |
| P/E | 5.26 | 6.21 | 21.31 | 29.91 | 21.82 |
| Current P/E | |||||
| Price | 390.3 | ||||
| EPS (TTM) | 20.49 | ||||
| P/E | 19.05 | ||||
[5] Aurobindo Pharma – Aurobindo Pharma Limited is a leading global pharmaceutical company, producing generic formulations and Active Pharmaceutical Ingredients (APIs). Nearly 90% of the Company’s revenue is driven by its international operations. Aurobindo operates through a network of 20 manufacturing facilities in India, three manufacturing facilities in the U.S., one in Brazil and one in Portugal.
Aurobindo markets its products and solutions across 150+ countries; with growing penetration in the U.S. and Europe.
Product Portfolio – Aurobindo is a market leader in semi-synthetic penicillin and has established a strong foothold in therapeutic areas, including antibiotics, antiretrovirals (ARVs), cardiovascular (CVS), central nervous systems (CNS), gastroenterologicals, anti-diabetics and antiallergics.
As on 31 March 2018, the Company filed 478 ANDAs on a cumulative basis. Of the total count, 327 have final approvals and 34 have tentative approvals and the balance 117 ANDAs are under review.
Capacity Expansion – To manufacture a growing product pipeline, the Company has taken significant steps towards capcity expansion and improvement to bolster volumes:
- Unit XVI: The Company has successfully commissioned Betalactum injectables manufacturing facility at Jadcherla, Telengana in FY 2018, which will improve the injectable volumes for the U.S., EU and Growth Markets.
- Unit X: The Company is building a USFDA compliant oral manufacturing facility at Naidupet, Andhra Pradesh; and the facility will be commissioned during FY2019. It has been inspected by USFDA and EMA.
- Injectable facility in US: The Company is in the process of setting up a non-Betalactum injectable manufacturing facility in the U.S.
U.S. Formulation Business – Well diversified product portfolio and new product launches has helped the Company to gain steady growth in U.S. market. In FY 2018, the Company launched 38 products, including six injectables in the U.S. market and filed 47 ANDAs with the USFDA, including for 16 injectables and received final approvals for 49 ANDAs, including seven injectables.
Aurobindo is continuously trying to build a strong product pipeline for the U.S. market with differentiated products which will help improve product mix and margins going forward.
| AUROBINDO | 5 YEAR AVERAGE P/E = 14.06 | ||||
| 2014 | 2015 | 2016 | 2017 | 2018 | |
| Price | 255.43 | 610.1 | 745 | 675.15 | 557.25 |
| EPS | 40 | 54 | 33.92 | 39.33 | 41.36 |
| P/E | 6.39 | 11.30 | 21.96 | 17.17 | 13.47 |
| Current P/E | |||||
| Price | 684.9 | ||||
| EPS (TTM) | 40.29 | ||||
| P/E | 17.00 | ||||
best price prescription drugs https://pharmacyken.com/ – pharmacy store near me legal drugs canada
proxy rx companion animal pharmacy canadian codeine pharmacy pharmacy technician online course