Unitech got into financial constraints and mismanagement as has been alleged sometime from 2013-2014 onwards, which resulted in non-delivery of sold units to the Homebuyers. This followed litigation at various fora and the promoters were lodged in jail in 2017. Finally, the Supreme Court intervened, which led to the supersession of the erstwhile management, replaced by an independent Board of Directors in January 2020.
DISCLIAMER: INVESTED AND INTERESTED
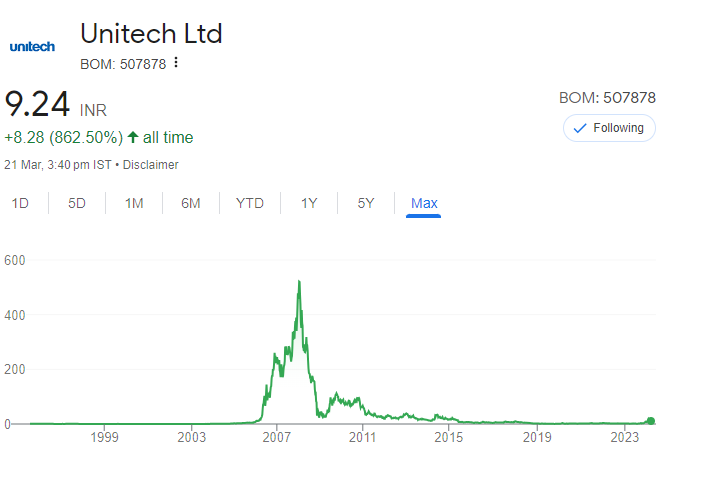
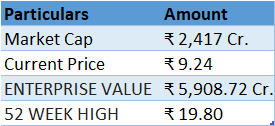
CMP: 9.25
Since then, the stock price of Unitech has taken a massive hit, coming down from Rs. 34/ share in June 2014 to Rs. 0.45/ share in October 2019.
Back in 2007, Unitech had entered into joint venture agreements (JVs) with certain companies to redevelop the lands in and around Dharavi slums. By virtue of these agreements, Unitech had the right to develop the underlying lands.
In late 2022, Adani group got a government contract to redevelop Dharavi. Perhaps this is what started the speculation around Adani Group acquiring or Unitech in order to get the rights to develop these lands. This seems unfounded since there is nothing on public record which shows that Unitech owns any land parcels in Dharavi.
That said, there could be other reasons why a potential acquisition of Unitech may not be ruled out. I am not aware of any such development and hence I do not wish to make any comments on this matter.
Business Overview:
Unitech started its business as a consultancy firm for soil and foundation engineering and diversified into real estate for construction of commercial complexes, IT/ ITes parks, SEZs, integrated residential developments, schools, hotels, malls, golf courses, and amusement parks. At present, the company has projects in locations viz. Ambala, Bangalore, Bhopal, Chennai, Dehradun, Greater Noida, Gurgaon, Kolkata, Mohali, Noida, Rewari
Unitech Finished Projects
a) Residential:
Nirvana Country and Nirvana Country 2 in Gurgaon, Vista Villas in Greenwood City, Karma Lakelands, Unitech Golf and Country Club in Noida, etc.
b) Commercial:
Grade ‘A’ complexes in Gurgaon like Cyber Park, Signature Towers, Global Business Parks, Unitech Business Park, Unitech Trade Centre, Millennium Plaza, Unitech Corporate Park, Nirvana Courtyards II, Signature Towers II, Uniworld Towers and Infospace in Gurgaon, Bhubaneswar 1 in Bhubaneswar, etc.
c) Malls:
Metro Walk in Rohini, The Great India Place in Noida, and Central in Gurgaon, etc.
Stressed financials
The company is still struggling on the financial front. Unitech posted a loss of Rs 627 crore in Q4 FY 2023 quarter as against Rs 318 crore loss in Q4FY22. Revenues came down by 39% at Rs 97 crore in the March quarter of FY23 as against Rs 160 crore in Q4FY22.
For FY23 Unitech posted a net loss of Rs 3,103 crore on revenues of Rs 406 crore. In FY22, it posted a net loss of Rs 1,026 crore on revenues of Rs 533 crore.
Unitech is so heavily burdened in debt today that the interest which it pays to service its debt is more than 6 times its gross sales before factoring in the expense incurred on making those sales. The company has a debt of Rs. 7200 crores (as per its latest 6 month filing in September 2023). In addition there The Company had received an arbitral award dated 6th July 2012 passed by the London Court of International Arbitration (LCIA) wherein the arbitration tribunal has directed the Company to purchase the investment of Cruz City 1 (a company owned by Lehman Bros.) in Kerrush Investment Ltd. (Mauritius) at the overall value of USD 298,382,949.34 (i.e. approximately Rs. 2400 Crores). This has been confirmed by the Delhi High Court.
| Mar-12 | Mar-13 | Mar-14 | Mar-15 | Mar-16 | Mar-17 | Mar-18 | Mar-19 | Mar-20 | Mar-21 | Mar-22 | Mar-23 | TTM | |
| Sales | 2,423 | 2,441 | 2,958 | 3,431 | 1,850 | 1,730 | 1,911 | 1,337 | 1,716 | 548 | 533 | 406 | 319 |
| Expenses | 2,094 | 2,110 | 2,760 | 2,525 | 2,560 | 1,971 | 1,956 | 1,534 | 2,182 | 635 | 561 | 432 | 344 |
| Operating Profit | 329 | 331 | 198 | 906 | -710 | -241 | -46 | -197 | -466 | -87 | -27 | -27 | -25 |
| OPM % | 14% | 14% | 7% | 26% | -38% | -14% | -2% | -15% | -27% | -16% | -5% | -7% | -8% |
| Other Income | 209 | 85 | 40 | -712 | 111 | 38 | -938 | -40 | -294 | -317 | 64 | 86 | 89 |
| Interest | 59 | 34 | 85 | 199 | 328 | 312 | 328 | 591 | 765 | 897 | 1,011 | 3,167 | 2,927 |
| Depreciation | 43 | 40 | 50 | 46 | 17 | 12 | 9 | 6 | 7 | 7 | 6 | 6 | 6 |
| Profit before tax | 436 | 342 | 103 | -51 | -944 | -528 | -1,320 | -834 | -1,531 | -1,308 | -981 | -3,114 | -2,870 |
| Tax % | 44% | 40% | 55% | -220% | 7% | 17% | 1% | 5% | -3% | -19% | -1% | 0% | |
| Net Profit | 245 | 205 | 46 | -162 | -880 | -427 | -1,306 | -794 | -1,583 | -1,608 | -1,026 | -3,103 | -2,862 |
| EPS in Rs | 0.91 | 0.8 | 0.27 | -0.49 | -3.44 | -1.54 | -4.83 | -3.02 | -5.97 | -6.09 | -3.87 | -10.65 | -9.19 |
![]()
Unitech’s financials continue to weaken due to low sales and outstanding debt that the company has been unable to repay.
In 2020, the newly appointed board submitted a roadmap for completing all stuck projects to the apex court. It proposed to complete the construction of all units within four years. As per the resolution plan, the board would require Rs 5,000 crore to complete the construction of units. (Given Below – from the annual report FY 2023)
Taking a leaf from the directions of the Supreme Court, the new management has taken up the construction and completion of various residential and commercial projects as its priority. It has made plans for the commencement of construction of 74 residential and 12 commercial projects, the completion of which would facilitate the delivery of completed units to more than 17,000 homebuyers. The management has already finalized a total of 49 tenders in this direction, which is awaiting approval of the Hon’ble Supreme Court for an award of contracts. The remaining tenders are also being finalized and proposed to be floated in the next lots on an ongoing basis. Funds for completion of these projects are to be arranged from the balance receivables from the Homebuyers and proceeds from the sale of unsold inventories.
However, after the government appointed new directors in 2020, not a single project of the Gurgaon-based developer has taken off.
Here’s some perspective on what’s happening in Unitech for those who are unfamiliar.
IITian Ramesh Chandra set up Unitech in 1971 to offer premium properties to hoebuyers.
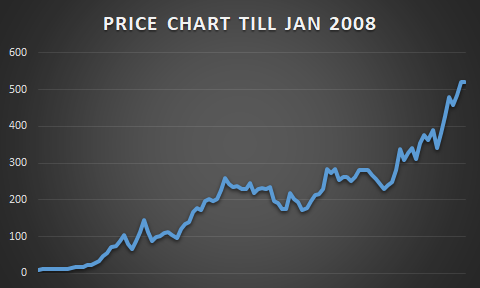
A golden period for Unitech came in 2007-08 when the company was valued at Rs 1.43 lakh crore. It made a net profit of Rs 1,669 crore on a total revenue of Rs 4,280 crore. Its stock hit an all-time high of Rs 547 in January 2008.
Amid the real estate boom of the time, the Unitech group, credited with building popular malls like Noida’s The Great India Place, Delhi’s Rohini Metro Walk, and Gurgaon’s The Couture and Gurgaon Central, went on to create a land bank of over 14,000 acres.
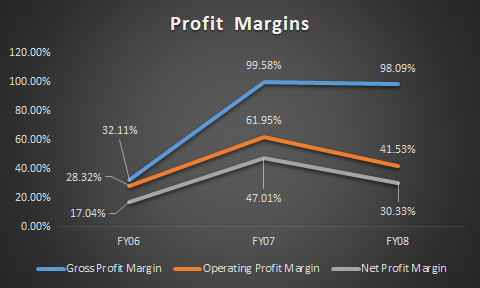
Profit Margin till FY08
Things began to go sideways when an economic slowdown hit the world in late 2008, India’s real estate sector also took a blow. Among India’s realty hotspots of the time, Gurgaon was one of the biggest casualties. By 2009, the sector’s depression had capped the growth prospects of the country’s major real estate players, including Unitech.
Another jolt shook the group two years later when Managing Director Sanjay Chandra was arrested in 2011 over his alleged involvement in the Rs 1.85 lakh-crore 2G spectrum scam and Uninor’s license was canceled.
Things came to such a pass in 2017 that followed litigation at various fora and the promoters were lodged in jail for below offences:
- For siphoning off Homebuyers’ money
- Non-Delivery of Promised Projects
- Criminal Cases and Investigation
- Financial Mismanagement
UNITECH’S Key Financial Metrics over the years.
| Mar-12 | Mar-13 | Mar-14 | Mar-15 | Mar-16 | Mar-17 | Mar-18 | Mar-19 | Mar-20 | Mar-21 | Mar-22 | Mar-23 | Sep-23 | |
| Equity Capital | 523 | 523 | 523 | 523 | 523 | 523 | 523 | 523 | 523 | 523 | 523 | 523 | 523 |
| Reserves | 11,501 | 10,867 | 11,037 | 10,418 | 8,670 | 8,689 | 6,691 | 5,717 | 4,089 | 2,512 | 1,479 | -1,378 | -2,607 |
| Borrowings | 4,505 | 5,117 | 5,396 | 4,716 | 2,888 | 2,910 | 3,615 | 3,555 | 3,859 | 6,932 | 6,989 | 7,167 | 7,205 |
| Other Liabilities | 6,640 | 7,960 | 10,422 | 12,188 | 14,832 | 16,068 | 15,795 | 17,340 | 17,406 | 15,912 | 17,742 | 20,573 | 21,738 |
| Total Liabilities | 23,169 | 24,467 | 27,378 | 27,846 | 26,914 | 28,189 | 26,624 | 27,135 | 25,877 | 25,880 | 26,733 | 26,886 | 26,860 |
| Fixed Assets | 3,328 | 3,586 | 4,275 | 3,472 | 2,157 | 2,120 | 1,006 | 828 | 489 | 465 | 464 | 463 | 463 |
| CWIP | 1,127 | 1,348 | 1,371 | 1,165 | 233 | 240 | 184 | 185 | 193 | 180 | 187 | 192 | 193 |
| Investments | 1,748 | 1,302 | 1,353 | 1,346 | 2,186 | 2,222 | 2,015 | 2,001 | 2,043 | 1,982 | 1,973 | 2,034 | 2,040 |
| Other Assets | 16,966 | 18,232 | 20,379 | 21,863 | 22,338 | 23,608 | 23,418 | 24,121 | 23,151 | 23,252 | 24,109 | 24,197 | 24,163 |
| Total Assets | 23,169 | 24,467 | 27,378 | 27,846 | 26,914 | 28,189 | 26,624 | 27,135 | 25,877 | 25,880 | 26,733 | 26,886 | 26,860 |
Today, the company has a debt of Rs. 7200 crore while its reserves have continuously declined. However, it is interesting to note that the company possesses a whopping Rs. 20,157 crore worth of other assets, which we believe mostly consist of a land bank covering approximately 30,000 acres. Whereas, the current market capitalization as of 20-03-2024 is Rs. 2302 crore.
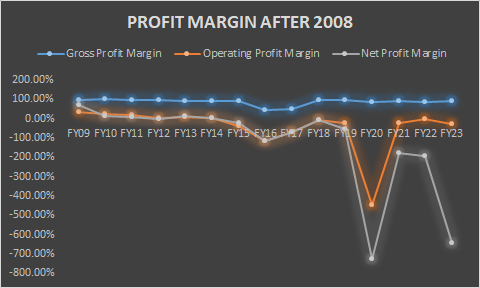
| Particulars | Gross Profit Margin | Operating Profit Margin | Net Profit Margin |
| FY09 | 96.87% | 32.41% | 70.64% |
| FY10 | 99.60% | 23.90% | 14.46% |
| FY11 | 95.61% | 16.20% | 10.56% |
| FY12 | 96.11% | 5.43% | 0.43% |
| FY13 | 89.14% | 9.40% | 15.80% |
| FY14 | 90.71% | 5.61% | 4.11% |
| FY15 | 88.89% | -39.71% | -21.60% |
| FY16 | 43.58% | -113.93% | -114.25% |
| FY17 | 51.38% | -67.82% | -71.30% |
| FY18 | 96.17% | -5.73% | -9.08% |
| FY19 | 94.86% | -22.26% | -51.15% |
| FY20 | 84.29% | -448.34% | -726.98% |
| FY21 | 91.25% | -24.06% | -175.99% |
| FY22 | 88.31% | -2.31% | -191.76% |
| FY23 | 88.69% | -25.70% | -643.60% |
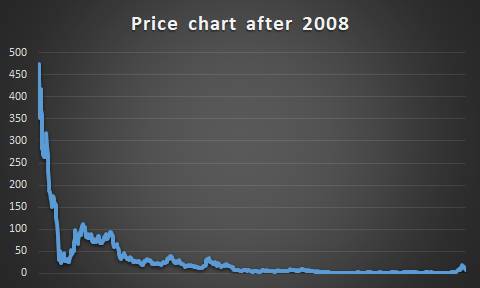
At the close trading on 24 March, Unitech’s shares were priced at Rs 8 apiece – a fall from an all-time high of Rs 547! – and the company had a market capitalization of Rs 1,725.66 crore.
SHAREHOLDING PATTERN
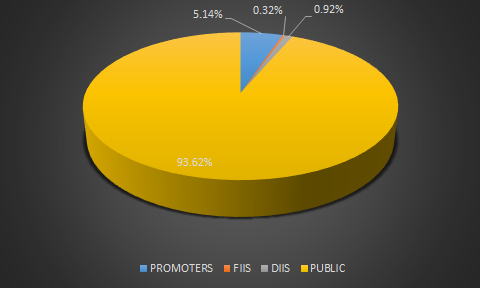
Finally, another notable thing is that the public owns almost 94% of Unitech Ltd shares with Promoters holding 5-6%. Given how illiquid the share is on most days, chances are that the holding of 261 crore shares (total number of issued shares) are held closely by a group of investors.
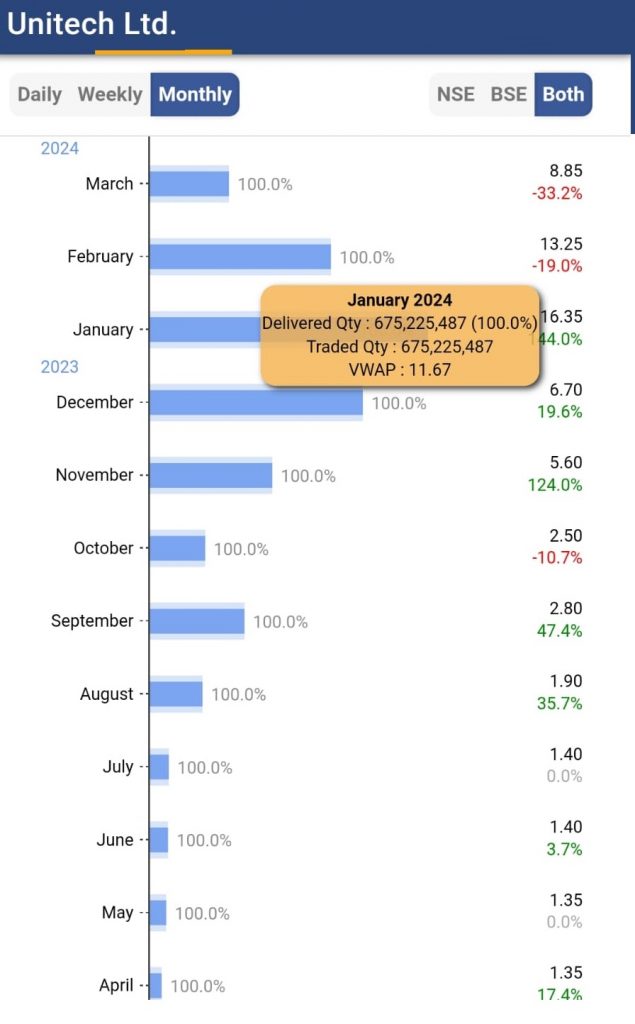
Another point to note is that over the past few months, the trading volume in Unitech has been rising somewhat constantly (and mysteriously). From April of 2023 To January of 2024, the trading volumes rose by over 2100% (from ~ 3 crore shares to 67crore + shares traded in each month respectively).
The other interesting pattern to note is that either there are only buyers or only sellers on a given day which points to a concerted activity on the part of a certain trader(s). It may well be a ploy to drive out retailers.
BE CAREFUL BEFORE INVESTING, IN CASE YOU DO!
Thanks Rajatji for your article. Could you share conclusion and swot analysis.
PLEASE MAKE SAME ON BRIGHTCOM GROUP
That story is long over I think.
Great research
Thank you.
Excellent research. The stock is already up 40%. Can I still buy?
I think the idea was to highlight how risky this investment could be 🙂
I have no comments.
Hi Rajatji,
This analysis helps a lot. Thanks.
In cases like these, where public holding is more than 90%, have there been cases of turn around? If yes, how do companies reduce the public holding? I.e. in case of acquisition by some company like Adani, how eill they reduce such massive public holding.
Kindly share your comments.
Regards,
Sachin
By doing an open offer.