With all the problems that Yes bank is facing, here’s a lowdown of what the bank is made of and why it is where it is today:
 Yes Bank Limited (“Yes” or the “Bank”) is one of India’s largest and still fastest growing private sector banks. The Bank currently services through a network of 1,110 branches and 1,781 ATMs spread across 29 Indian states and 7 Union Territories.
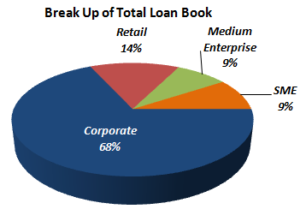
The credit book continues to be largely driven by corporate portfolio which rose by 63% Y-o-Y and currently forms 68.2% of the total book. Core Retail Banking advances more than doubled in last one year & now stand at 14% of total advances, coupled with healthy growth of >30% in MSME.
| Business Segment | As on Dec 31, 2018 | As on Dec 31, 2017 | Growth (y-o-y) | As on Sep 30, 2018 | Growth (y-o-y) |
| A) Corporate Banking | 67.8% | 67.7% | 42.5% | 68.2% | 1.3% |
| B) Retail & Business Banking | 32.2% | 32.3% | 41.5% | 31.8% | 2.8% |
| of which: | |||||
| i) Medium Enterprises | 7.8% | 9.9% | 12.4% | 8.3% | -4.1% |
| ii) Small and Micro Enterprises | 9.2% | 10.6% | 22.4% | 9.2% | 1.0% |
| iii) Retail Banking | 15.2% | 11.8% | 82.9% | 14.3% | 8.0% |
| Total | 100.0% | 100.0% | 42.2% | 100.0% | 1.8% |
CAVEAT: 3.63% of Promoter’s Holding is pledged.
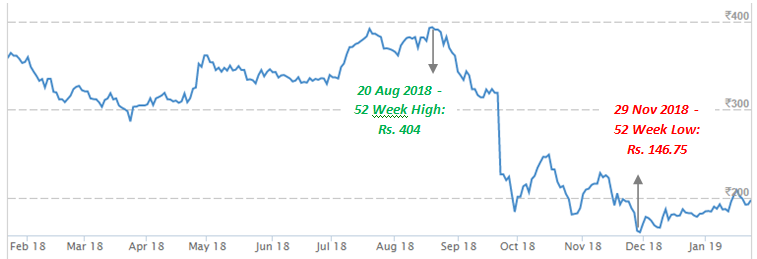
In one year, the stock price has fallen 41%, from Rs. 364.80 to Rs. 215.40
CHALLENGES FACED BY YES BANK: OMNIPRESENT SUSPICION BY ANALYSTS THAT ALL MAY NOT BE WELL IF THERE WAS A FORENSIC.
For the past decade, yes bank has grown phenomenally giving competition to some of the most established private sector banks while maintain a low NPA base even though it operated in the same geography as some of its larger peers.
- The problems started when RBI denied extension of Mr. Rana Kapur to continue as MD and CEO of the bank for next three years.
- Rating agencies ICRA Ltd and CARE Ratings Ltd downgraded Yes Bank lender’s debt instruments.
- Moody’s Investors Service downgraded Yes Bank’s ratings citing corporate governance concerns and impact of leadership change on bank’s growth plan.
- Resignation of Ashok Chawla, non-executive chairman of Yes Bank Ltd, after being named in a corruption charge sheet (Aircel-Maxis case) by the Central Bureau of Investigation (CBI).
- As per media reports, promoters through two of its entities (Yes Capital (India) Private Limited and Morgan Credits Private Limited) have pledged their shares for borrowing debt on personal count. Such transactions were never reported and that to lead losing credibility on the operations of the bank.
Financial Position
| Particulars | FY14 | FY15 | FY16 | FY17 | FY18 |
| Net Interest Income
(In Rs. Cr.) |
2,716.30 | 3,487.80 | 4,566.70 | 5,797.30 | 7,737.10 |
| Growth | – | 28.4% | 30.9% | 26.9% | 33.5% |
| Non Interest Income
(In Rs. Cr.) |
1,721.50 | 2,046.50 | 2,712.10 | 4,156.80 | 5,223.80 |
| Growth | – | 18.9% | 32.5% | 53.3% | 25.7% |
| Total Net Income (In Rs. Cr.) | 4,437.80 | 5,534.30 | 7,278.80 | 9,954.10 | 12,960.90 |
| Operating Profit (In Rs. Cr.) | 2,688.00 | 3,249.60 | 4,302.50 | 5,837.50 | 7,758.78 |
| Net Profit (In Rs. Cr.) | 1,617.80 | 2,005.40 | 2,539.40 | 3,330.10 | 4,224.60 |
| EPS (In Rs.) | 8.80 | 9.60 | 12.12 | 15.40 | 18.09 |
| EPS Growth Rate | – | 9% | 26% | 27% | 17% |
| Historic P/E (Closing Price of 31st March) | 9.41 | 16.99 | 14.27 | 20.09 | 16.85 |
| CURRENT P/E (based on price of 24th January – Rs. 215.40 and EPS TTM – Rs. 18.81) | 11.45 | ||||
| Historic P/B (Closing Price of 31st March) | 4.07 | 2.38 | 4.06 | 3.47 | 2.73 |
| CURRENT P/B (based on price of 24th January – Rs. 215.40) | 1.93 | ||||
| Net Profit Margin Ratio % | 13.77 | 14.67 | 15.56 | 16.18 | 16.56 |
| Cost to Net Income Ratio % | 51.71 | 41.46 | 41.19 | 47.34 | 59.89 |
| Other Income to Net Income Ratio % | 38.79 | 36.99 | 37.41 | 47.90 | 60.11 |
| ROCE | 9.45% | 8.58% | 9.47% | 9.63% | 7.71% |
| ROE | 22.74% | 17.19% | 18.45% | 15.11% | 16.40% |
*Stock split in the ratio of 1:5 on 21 September, 2017.
Quarterly Results
| Particulars | Q3 FY 2018 | Q2 FY 2019 | Q3 FY 2019 | TTM | Q-o-Q % | Y-o-Y % |
| Net Interest Income
(In Rs. Cr.) |
1,888.80 | 2,417.60 | 2,666.41 | 9,457.31 | 10.29% | 41.17% |
| Growth | 0% | 9% | 10% | |||
| Operating Profit
(In Rs. Cr.) |
2,001.81 | 2,366.44 | 1,990.36 | 8,946.94 | -15.89% | -0.57% |
| PAT (In Rs. Cr.) | 1,076.87 | 964.7 | 1,001.85 | 4,406.35 | 3.85% | -6.97% |
| EPS (In Rs.) | 4.61 | 4.06 | 4.3 | 18.81 | 5.91% | -6.72% |
Q2 FY 2019 Highlights:
- Yes Bank’s Q3 FY19 net profit fell 7% y-o-y due to higher provisioning & NPA pressure.
- NII increase was healthy at 41% YoY to Rs. 2,666.41 Cr.
- GNPA ratio increased to 2.10% vs. 1.72%.
- The Bank’s exposure to IL&FS is Rs. 2530 Cr.
Peers Comparison
| Name | Price (Rs.) | Market Cap. (Rs. Cr.) | NPA
Q3 FY 2019 |
P/E (x) | P/B (x) |
| HDFC Bank | 2,102.25 | 571,707.18 | 0.42% | 30.01 | 5.20 |
| Kotak Mahindra | 1,267.75 | 241,847.74 | 0.67% | 35.90 | 4.79 |
| ICICI Bank | 364.8 | 234,981.23 | 2.58% | 67.93 | 2.07 |
| Axis Bank | 663.65 | 170,560.46 | 2.36% | 331.83 | 3.65 |
| IndusInd Bank | 1,490.30 | 89,773.98 | 0.59% | 23.06 | 3.83 |
| Bandhan Bank | 413.90 | 49,374.56 | 0.70% | 29.80 | 5.26 |
| RBL Bank | 578.15 | 24,606.33 | 0.72% | 17.45 | 3.67 |
| IDFC First Bank | 47.1 | 22,520.97 | 0.95% | 15.70 | 1.35 |
| Federal Bank | 88.9 | 17,636.92 | 1.72% | 18.87 | 1.44 |
| City Union Bank | 190.05 | 13,909.53 | 1.74% | 21.84 | 3.91 |
| Karur Vysya | 92 | 7,353.60 | (4.41%) | 29.21 | 1.17 |
| DCB Bank | 181.85 | 5,624.78 | 0.71% | 21.29 | 2.20 |
| Karnataka Bank | 120.7 | 3,411.08 | 3% | 9.13 | 0.68 |
| South Ind Bank | 13.8 | 2,497.36 | 2.60% | 7.75 | 0.50 |
| Average | 47.13 | 2.84 | |||
| Yes Bank | 215.40 | 49,818.91 | 1.18% | 11.11 | 2.68 |
*NPAs figure in bracket indicates numbers as of Q2 FY 2019. Will update once their results are out. Price and Market Cap as on 24th Jan, 2019
WHAT’S DRIVING THE STOCK?
Robust Loan Growth
Over the years, Yes Bank has grown its credit almost entirely on the back of the corporate sector, which constitutes ~68% of its outstanding credit of Rs. 239,627 Cr. as on Q3 FY 2019. The credit book traction continued to be robust at 42.2% YoY, mainly witnessing an up-tick in the corporate and retail segments. As on Q3 FY 2019, large corporates constituted 67.8% while SME/retail constituted 32.2%. The management guided that the proportion of SME/retail may increase from ~32% now to ~45% of total credit by FY20. Being a high yielding segment, it will support NIM, going ahead (Forward lookin).
Improvement in CASA Ratio
Deposit growth stood at 29.7% YoY to Rs. 222,758 Cr. in Q3 FY 2019. CASA ratio stood at 33.3% in Q3 FY 2019 vs. 33.8% in Q3 FY 2018. Savings and current balances increased by 26.5% and 31.6% YoY to Rs. 49,339 Cr. and Rs. 25,940 Cr., respectively. The growth in CASA was largely due to the bank’s branch expansion and leveraging of its existing branch network and partly due to demonetisation.
New Management
The Bank has grown at strong pace in the past and a stable top management along with capital is all that it will require to gain its lost market share.
The Bank earlier commanded premium owing to its management role. Due to uncertainty with regard to top management appointment, RBI report on NPA divergences and issues relating to capital raising, the Bank has lost all the premium valuations. Going forward, investors have to look at how Yes Bank would fare under its new leadership.
- Ravneet Gill will be taking over as CEO and MD from March 1, 2019.
- He has been with the bank since August, 2012. He has close to 28 years of banking experience across several fields, including private banking, foreign exchange, structured financing, risk management and transaction banking.
- Gill first joined Deutsche Bank’s Private Wealth Management division in 1991. He was appointed as the Head of Capital Markets and Treasury Solutions, India in 2011.
WHAT’S DRAGGING THE STOCK?
Asset Quality Deteriorated
Asset quality witnessed pressure in Q3 FY 2019 with GNPA ratio increasing to 2.1% vs. 1.6% in Q2 FY 2019. During the quarter, slippages increased and stood at Rs. 2,297 Cr. vs. Rs. 1,631 Cr. seen in Q2 FY 2019. The Bank indicated that gross outstanding exposure to IL&FS is Rs. 2,530 Cr.
Generic | Industry Specific: Intense competition, Threat of New Entrants
Many of the services that were traditionally performed by the banks are now being performed by other players such as depositories, NBFCs and brokerage houses which have intensified competition in the banking industry.
Fintechs Disrupting Financial Service Market through innovative solutions across wide range of services such as payments, lending, data analytics, wealth management.
If you have to choose between AB Capital and Yes Bank, which would you choose?
neither at this point
Thanks for your analysis How is Rbl bank at present for Longterm investment?
Open a bank account with RBL…. thats a better decision at this point , for long term.